Zip Codes with the Highest Percentage of Population with a Degree in Visual and Performing Arts in Lakewood, WA
RELATED REPORTS & OPTIONS
Visual and Performing Arts
Lakewood
Compare Zip Codes
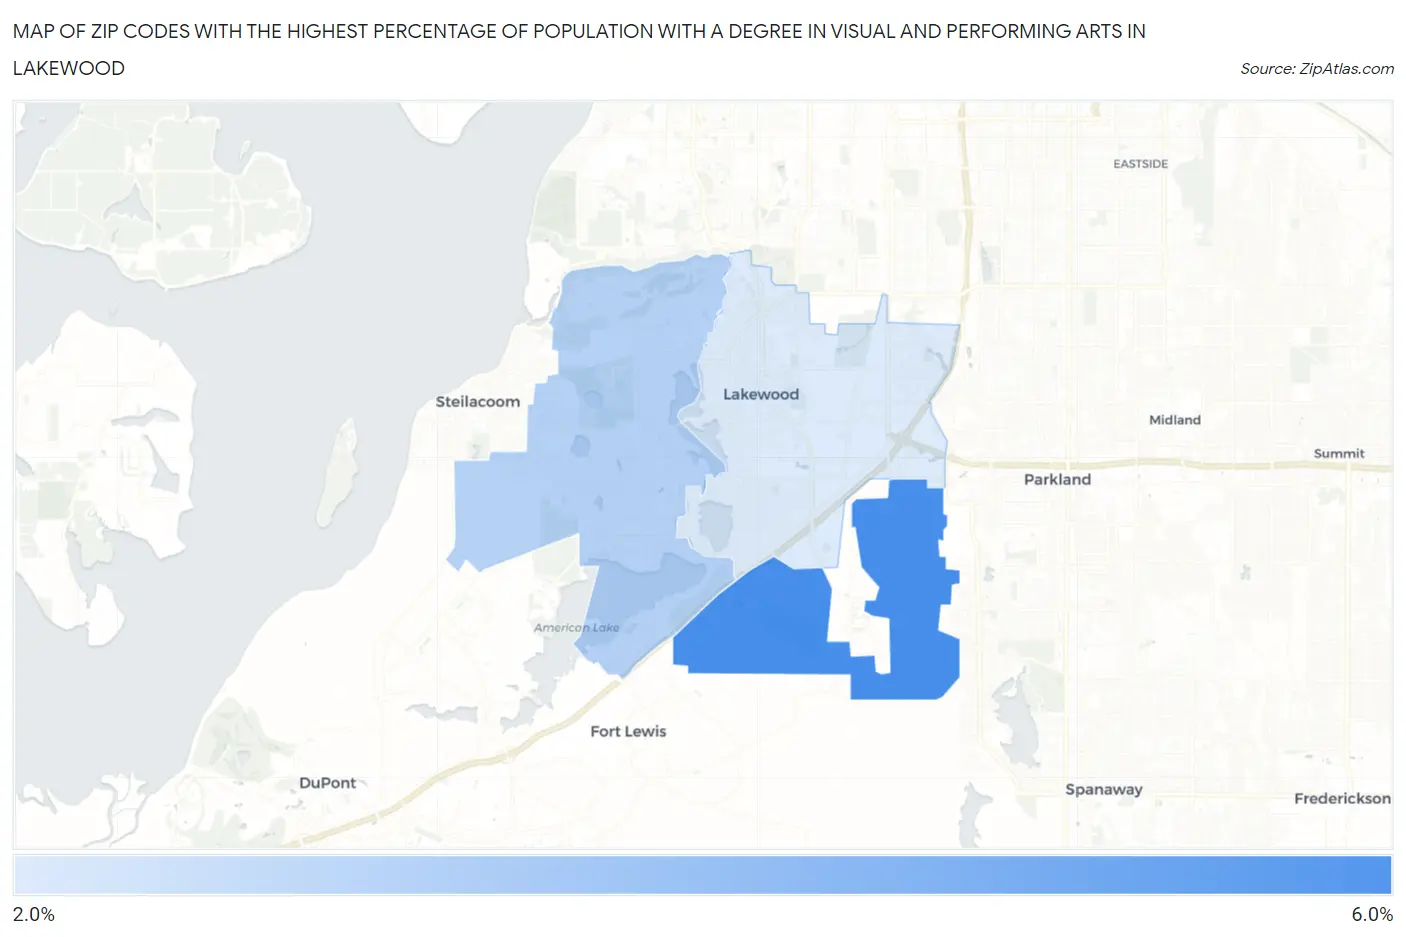
Map of Zip Codes with the Highest Percentage of Population with a Degree in Visual and Performing Arts in Lakewood
3.0%
5.8%
Zip Codes with the Highest Percentage of Population with a Degree in Visual and Performing Arts in Lakewood, WA
| Zip Code | % Graduates | vs State | vs National | |
| 1. | 98439 | 5.8% | 4.6%(+1.19)#130 | 4.3%(+1.56)#5,155 |
| 2. | 98498 | 3.7% | 4.6%(-0.930)#259 | 4.3%(-0.563)#10,202 |
| 3. | 98499 | 3.0% | 4.6%(-1.65)#323 | 4.3%(-1.28)#12,843 |
1
Common Questions
What are the Top Zip Codes with the Highest Percentage of Population with a Degree in Visual and Performing Arts in Lakewood, WA?
Top Zip Codes with the Highest Percentage of Population with a Degree in Visual and Performing Arts in Lakewood, WA are:
What zip code has the Highest Percentage of Population with a Degree in Visual and Performing Arts in Lakewood, WA?
98439 has the Highest Percentage of Population with a Degree in Visual and Performing Arts in Lakewood, WA with 5.8%.
What is the Percentage of Population with a Degree in Visual and Performing Arts in Lakewood, WA?
Percentage of Population with a Degree in Visual and Performing Arts in Lakewood is 3.4%.
What is the Percentage of Population with a Degree in Visual and Performing Arts in Washington?
Percentage of Population with a Degree in Visual and Performing Arts in Washington is 4.6%.
What is the Percentage of Population with a Degree in Visual and Performing Arts in the United States?
Percentage of Population with a Degree in Visual and Performing Arts in the United States is 4.3%.