Zip Codes with the Highest Percentage of Population with a Degree in Visual and Performing Arts in Kennewick, WA
RELATED REPORTS & OPTIONS
Visual and Performing Arts
Kennewick
Compare Zip Codes
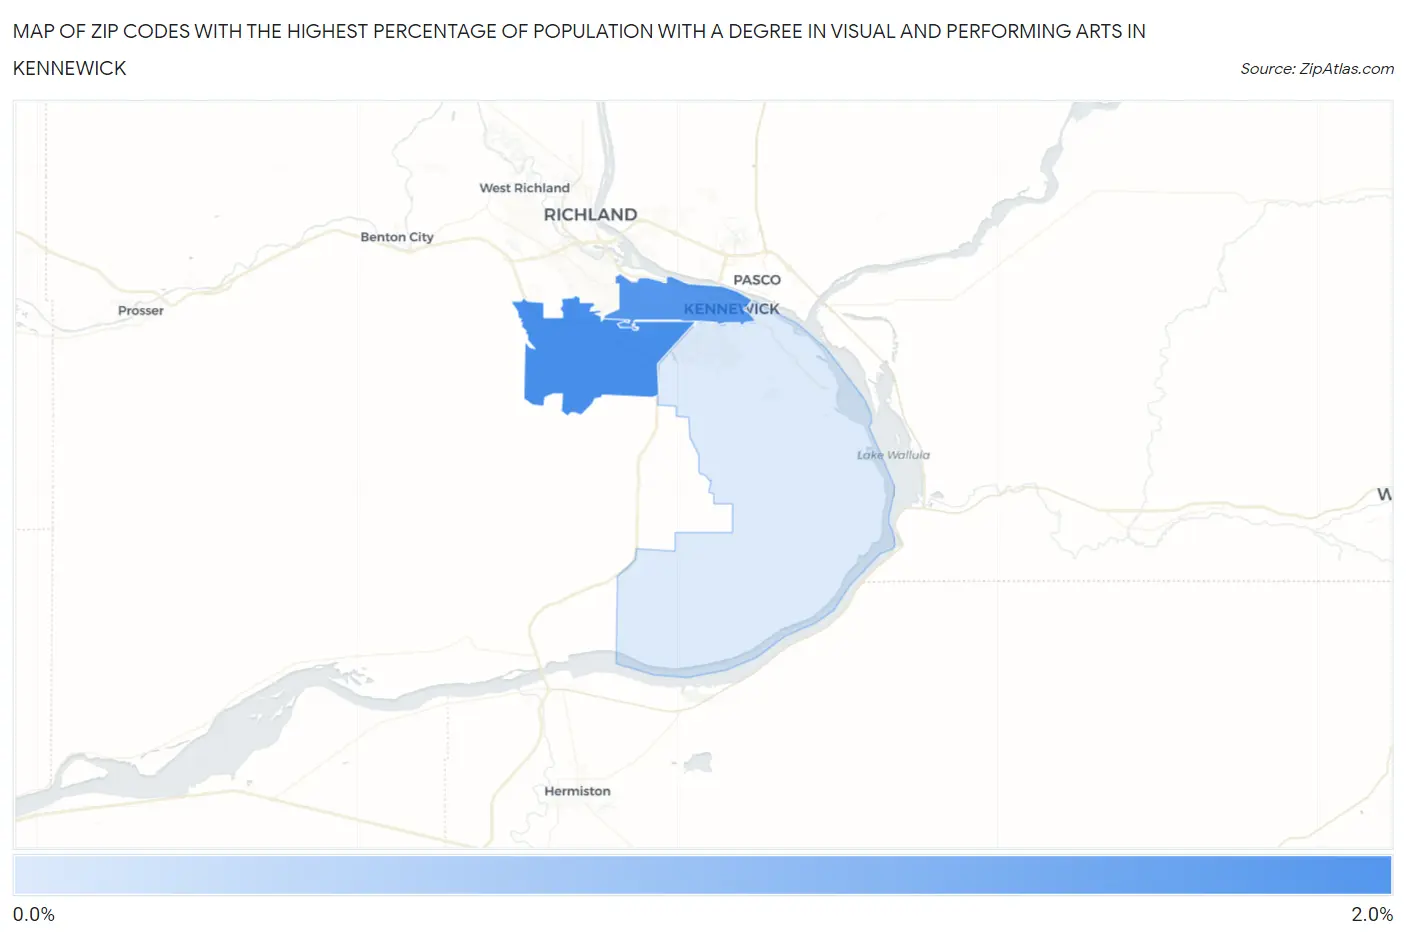
Map of Zip Codes with the Highest Percentage of Population with a Degree in Visual and Performing Arts in Kennewick
0.91%
1.7%
Zip Codes with the Highest Percentage of Population with a Degree in Visual and Performing Arts in Kennewick, WA
| Zip Code | % Graduates | vs State | vs National | |
| 1. | 99338 | 1.7% | 4.6%(-2.93)#391 | 4.3%(-2.56)#17,530 |
| 2. | 99336 | 1.6% | 4.6%(-3.01)#393 | 4.3%(-2.64)#17,806 |
| 3. | 99337 | 0.91% | 4.6%(-3.71)#425 | 4.3%(-3.35)#19,917 |
1
Common Questions
What are the Top Zip Codes with the Highest Percentage of Population with a Degree in Visual and Performing Arts in Kennewick, WA?
Top Zip Codes with the Highest Percentage of Population with a Degree in Visual and Performing Arts in Kennewick, WA are:
What zip code has the Highest Percentage of Population with a Degree in Visual and Performing Arts in Kennewick, WA?
99338 has the Highest Percentage of Population with a Degree in Visual and Performing Arts in Kennewick, WA with 1.7%.
What is the Percentage of Population with a Degree in Visual and Performing Arts in Kennewick, WA?
Percentage of Population with a Degree in Visual and Performing Arts in Kennewick is 1.4%.
What is the Percentage of Population with a Degree in Visual and Performing Arts in Washington?
Percentage of Population with a Degree in Visual and Performing Arts in Washington is 4.6%.
What is the Percentage of Population with a Degree in Visual and Performing Arts in the United States?
Percentage of Population with a Degree in Visual and Performing Arts in the United States is 4.3%.