Zip Codes with the Most Immigrants from South Eastern Asia in Tacoma, WA
RELATED REPORTS & OPTIONS
South Eastern Asia
Tacoma
Compare Zip Codes
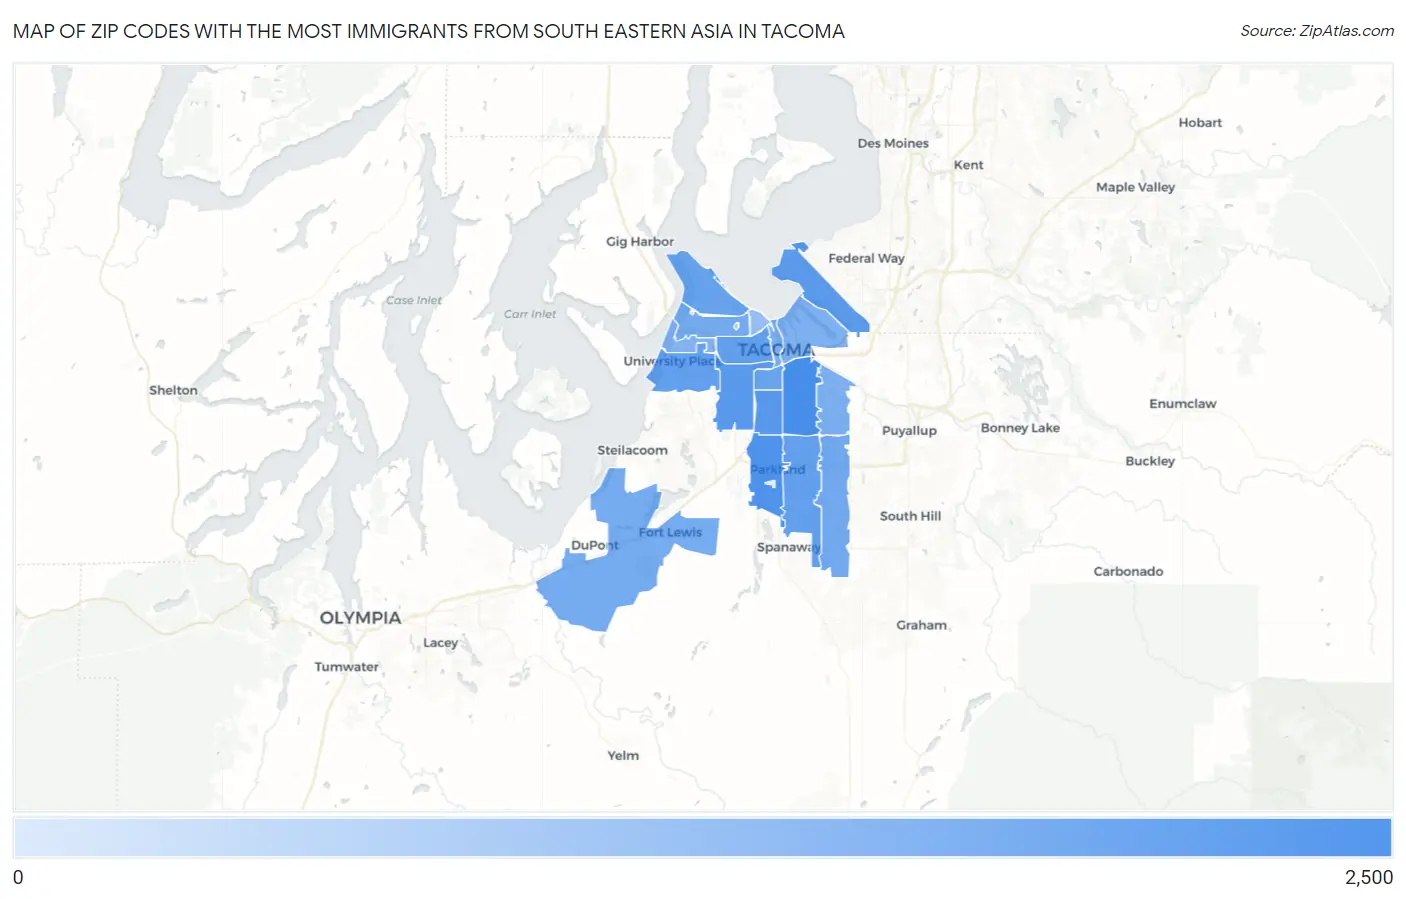
Map of Zip Codes with the Most Immigrants from South Eastern Asia in Tacoma
13
2,327
Zip Codes with the Most Immigrants from South Eastern Asia in Tacoma, WA
| Zip Code | South Eastern Asia | vs State | vs National | |
| 1. | 98404 | 2,327 | 172,368(1.35%)#15 | 4,292,058(0.05%)#317 |
| 2. | 98444 | 1,610 | 172,368(0.93%)#32 | 4,292,058(0.04%)#527 |
| 3. | 98408 | 967 | 172,368(0.56%)#53 | 4,292,058(0.02%)#1,009 |
| 4. | 98409 | 953 | 172,368(0.55%)#55 | 4,292,058(0.02%)#1,028 |
| 5. | 98422 | 821 | 172,368(0.48%)#63 | 4,292,058(0.02%)#1,207 |
| 6. | 98445 | 588 | 172,368(0.34%)#83 | 4,292,058(0.01%)#1,647 |
| 7. | 98466 | 561 | 172,368(0.33%)#88 | 4,292,058(0.01%)#1,734 |
| 8. | 98405 | 541 | 172,368(0.31%)#93 | 4,292,058(0.01%)#1,789 |
| 9. | 98418 | 411 | 172,368(0.24%)#114 | 4,292,058(0.01%)#2,298 |
| 10. | 98407 | 374 | 172,368(0.22%)#123 | 4,292,058(0.01%)#2,480 |
| 11. | 98446 | 247 | 172,368(0.14%)#148 | 4,292,058(0.01%)#3,447 |
| 12. | 98406 | 215 | 172,368(0.12%)#155 | 4,292,058(0.01%)#3,807 |
| 13. | 98433 | 212 | 172,368(0.12%)#157 | 4,292,058(0.00%)#3,858 |
| 14. | 98402 | 156 | 172,368(0.09%)#181 | 4,292,058(0.00%)#4,732 |
| 15. | 98443 | 145 | 172,368(0.08%)#187 | 4,292,058(0.00%)#4,915 |
| 16. | 98421 | 128 | 172,368(0.07%)#196 | 4,292,058(0.00%)#5,266 |
| 17. | 98465 | 91 | 172,368(0.05%)#214 | 4,292,058(0.00%)#6,187 |
| 18. | 98403 | 33 | 172,368(0.02%)#265 | 4,292,058(0.00%)#8,944 |
| 19. | 98416 | 13 | 172,368(0.01%)#314 | 4,292,058(0.00%)#11,401 |
1
Common Questions
What are the Top 10 Zip Codes with the Most Immigrants from South Eastern Asia in Tacoma, WA?
Top 10 Zip Codes with the Most Immigrants from South Eastern Asia in Tacoma, WA are:
What zip code has the Most Immigrants from South Eastern Asia in Tacoma, WA?
98404 has the Most Immigrants from South Eastern Asia in Tacoma, WA with 2,327.
What is the Total Immigrants from South Eastern Asia in Tacoma, WA?
Total Immigrants from South Eastern Asia in Tacoma is 7,776.
What is the Total Immigrants from South Eastern Asia in Washington?
Total Immigrants from South Eastern Asia in Washington is 172,368.
What is the Total Immigrants from South Eastern Asia in the United States?
Total Immigrants from South Eastern Asia in the United States is 4,292,058.