Zip Codes with the Highest Percentage of Population with a Degree in Visual and Performing Arts in Olympia, WA
RELATED REPORTS & OPTIONS
Visual and Performing Arts
Olympia
Compare Zip Codes
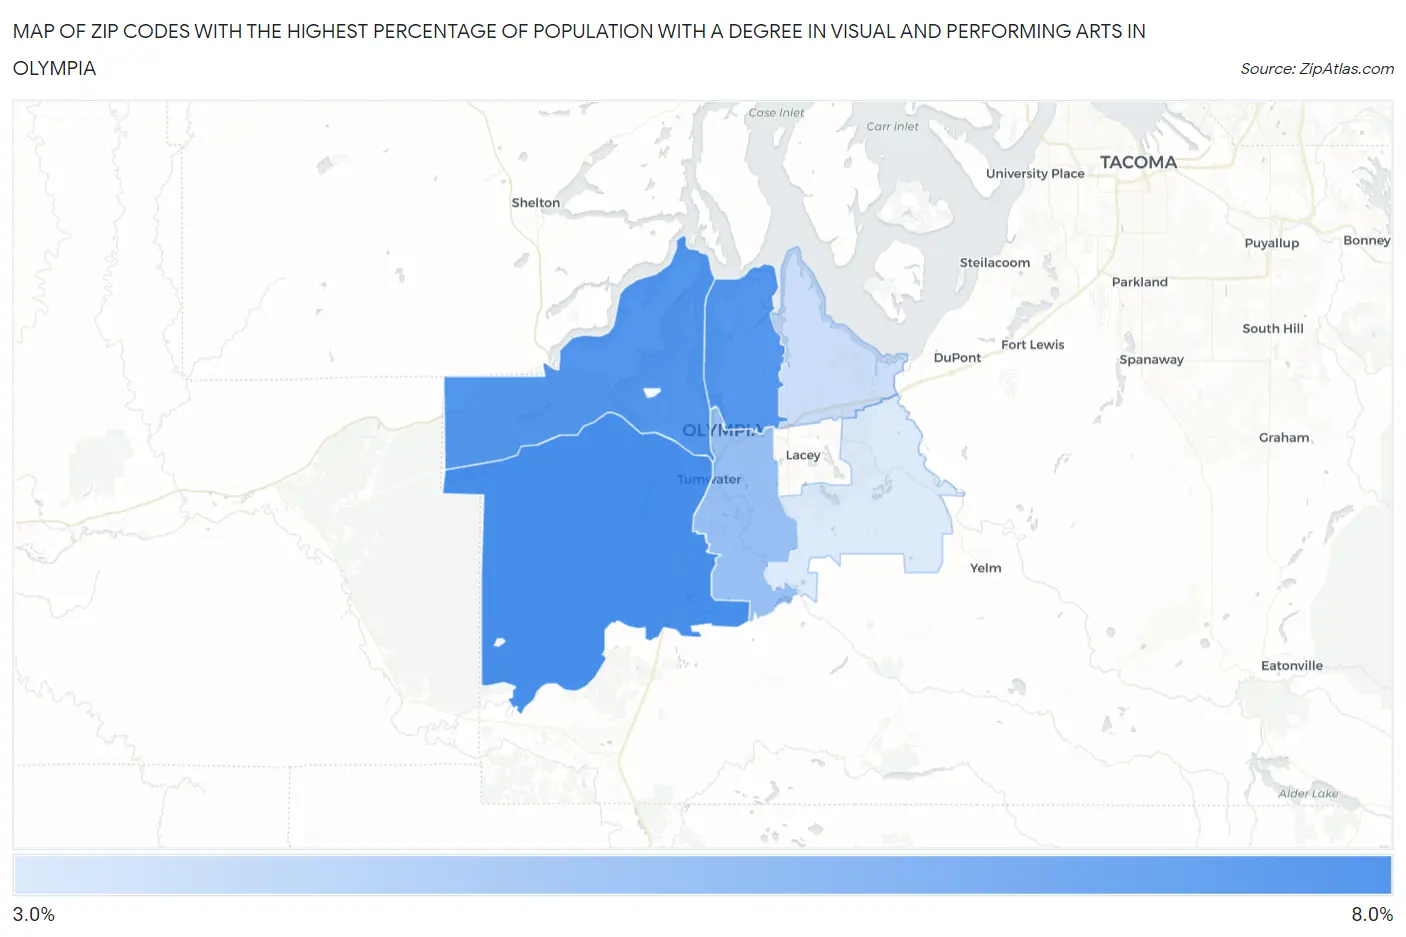
Map of Zip Codes with the Highest Percentage of Population with a Degree in Visual and Performing Arts in Olympia
3.0%
6.1%
Zip Codes with the Highest Percentage of Population with a Degree in Visual and Performing Arts in Olympia, WA
| Zip Code | % Graduates | vs State | vs National | |
| 1. | 98512 | 6.1% | 4.6%(+1.51)#118 | 4.3%(+1.88)#4,705 |
| 2. | 98502 | 5.9% | 4.6%(+1.26)#126 | 4.3%(+1.62)#5,049 |
| 3. | 98506 | 5.8% | 4.6%(+1.23)#129 | 4.3%(+1.59)#5,108 |
| 4. | 98501 | 4.5% | 4.6%(-0.159)#202 | 4.3%(+0.208)#7,914 |
| 5. | 98516 | 3.4% | 4.6%(-1.19)#283 | 4.3%(-0.828)#11,165 |
| 6. | 98513 | 3.0% | 4.6%(-1.60)#318 | 4.3%(-1.23)#12,666 |
1
Common Questions
What are the Top 5 Zip Codes with the Highest Percentage of Population with a Degree in Visual and Performing Arts in Olympia, WA?
Top 5 Zip Codes with the Highest Percentage of Population with a Degree in Visual and Performing Arts in Olympia, WA are:
What zip code has the Highest Percentage of Population with a Degree in Visual and Performing Arts in Olympia, WA?
98512 has the Highest Percentage of Population with a Degree in Visual and Performing Arts in Olympia, WA with 6.1%.
What is the Percentage of Population with a Degree in Visual and Performing Arts in Olympia, WA?
Percentage of Population with a Degree in Visual and Performing Arts in Olympia is 6.1%.
What is the Percentage of Population with a Degree in Visual and Performing Arts in Washington?
Percentage of Population with a Degree in Visual and Performing Arts in Washington is 4.6%.
What is the Percentage of Population with a Degree in Visual and Performing Arts in the United States?
Percentage of Population with a Degree in Visual and Performing Arts in the United States is 4.3%.