Zip Codes with the Highest Percentage of Population with a Degree in Visual and Performing Arts in Redmond, WA
RELATED REPORTS & OPTIONS
Visual and Performing Arts
Redmond
Compare Zip Codes
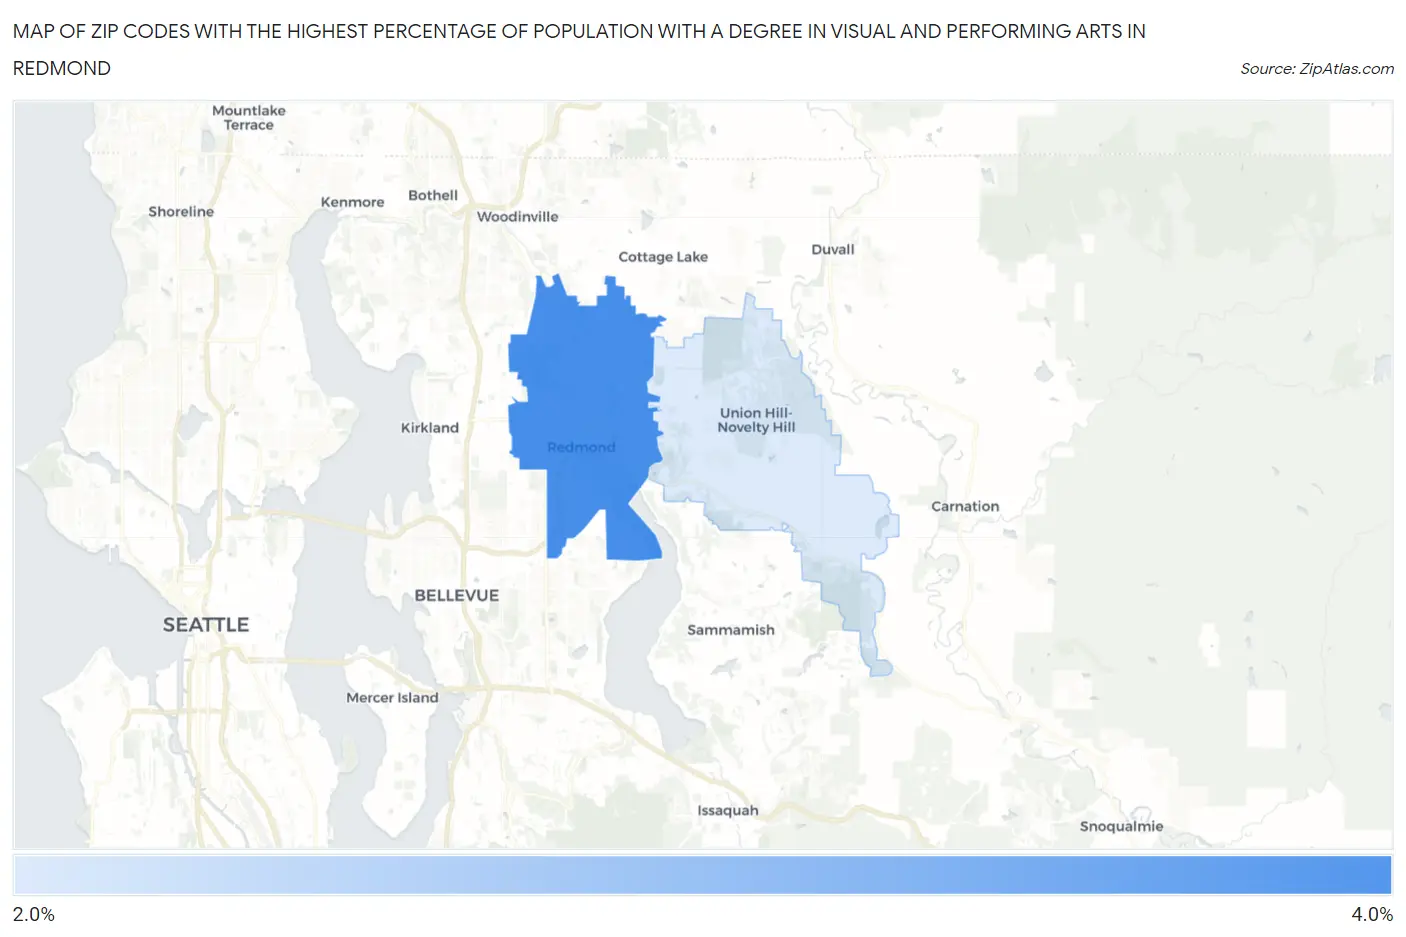
Map of Zip Codes with the Highest Percentage of Population with a Degree in Visual and Performing Arts in Redmond
2.6%
3.4%
Zip Codes with the Highest Percentage of Population with a Degree in Visual and Performing Arts in Redmond, WA
| Zip Code | % Graduates | vs State | vs National | |
| 1. | 98052 | 3.4% | 4.6%(-1.25)#288 | 4.3%(-0.879)#11,333 |
| 2. | 98053 | 2.6% | 4.6%(-1.99)#350 | 4.3%(-1.62)#14,163 |
1
Common Questions
What are the Top Zip Codes with the Highest Percentage of Population with a Degree in Visual and Performing Arts in Redmond, WA?
Top Zip Codes with the Highest Percentage of Population with a Degree in Visual and Performing Arts in Redmond, WA are:
What zip code has the Highest Percentage of Population with a Degree in Visual and Performing Arts in Redmond, WA?
98052 has the Highest Percentage of Population with a Degree in Visual and Performing Arts in Redmond, WA with 3.4%.
What is the Percentage of Population with a Degree in Visual and Performing Arts in Redmond, WA?
Percentage of Population with a Degree in Visual and Performing Arts in Redmond is 3.5%.
What is the Percentage of Population with a Degree in Visual and Performing Arts in Washington?
Percentage of Population with a Degree in Visual and Performing Arts in Washington is 4.6%.
What is the Percentage of Population with a Degree in Visual and Performing Arts in the United States?
Percentage of Population with a Degree in Visual and Performing Arts in the United States is 4.3%.