Zip Codes with the Highest Percentage of Population Employed in Life, Physical & Social Science in Tacoma, WA
RELATED REPORTS & OPTIONS
Life, Physical & Social Science
Tacoma
Compare Zip Codes
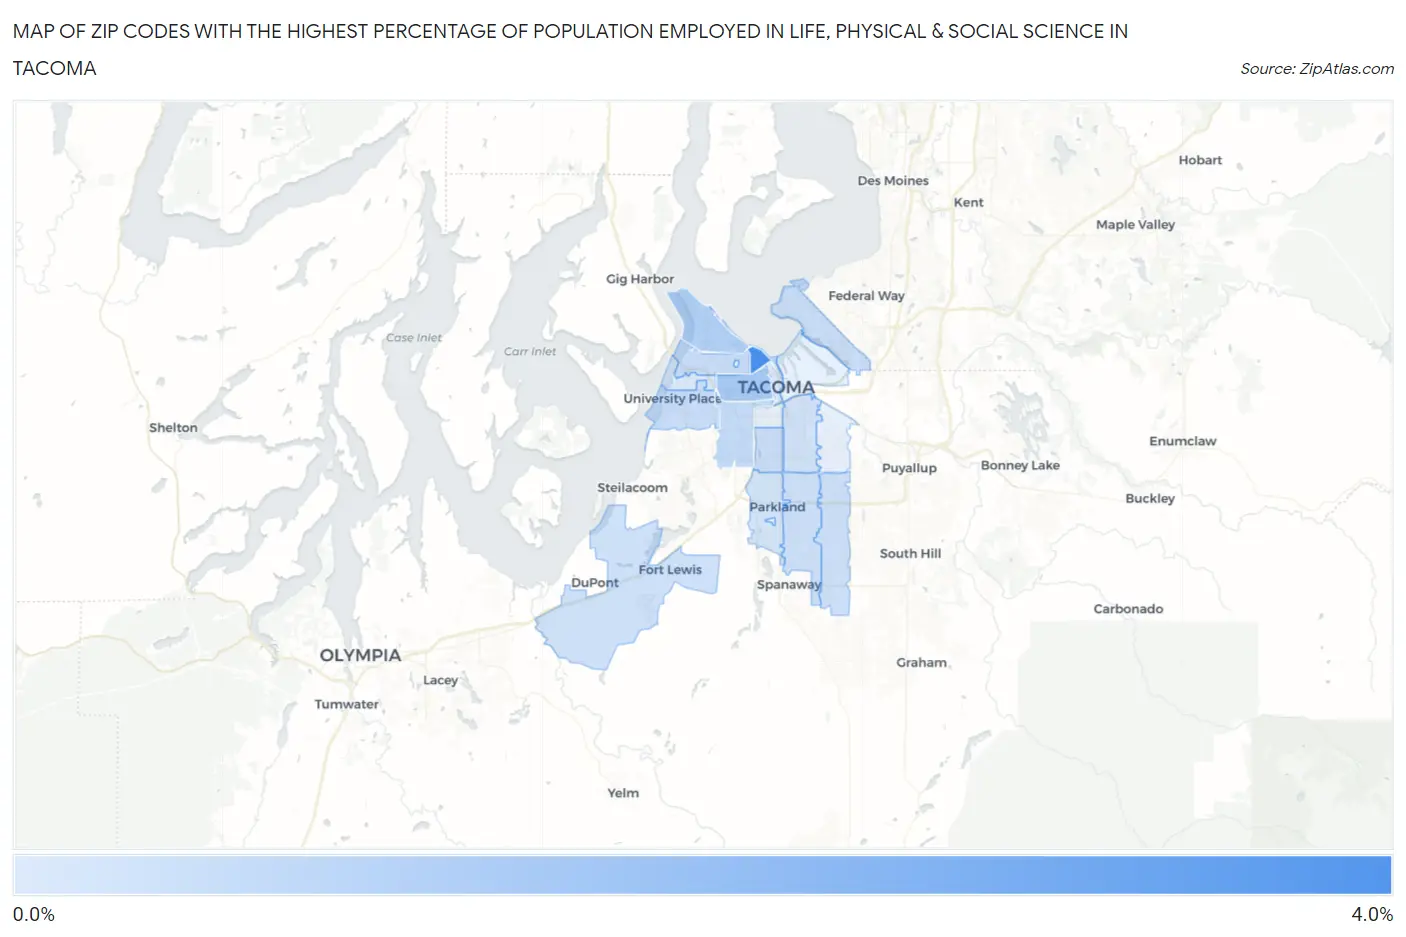
Map of Zip Codes with the Highest Percentage of Population Employed in Life, Physical & Social Science in Tacoma
0.30%
3.8%
Zip Codes with the Highest Percentage of Population Employed in Life, Physical & Social Science in Tacoma, WA
| Zip Code | % Employed | vs State | vs National | |
| 1. | 98403 | 3.8% | 1.3%(+2.51)#40 | 1.1%(+2.73)#1,250 |
| 2. | 98405 | 1.5% | 1.3%(+0.238)#141 | 1.1%(+0.458)#5,380 |
| 3. | 98407 | 1.3% | 1.3%(-0.049)#190 | 1.1%(+0.171)#7,044 |
| 4. | 98409 | 0.88% | 1.3%(-0.434)#245 | 1.1%(-0.214)#10,167 |
| 5. | 98406 | 0.80% | 1.3%(-0.512)#266 | 1.1%(-0.291)#11,006 |
| 6. | 98466 | 0.79% | 1.3%(-0.526)#268 | 1.1%(-0.306)#11,147 |
| 7. | 98422 | 0.75% | 1.3%(-0.559)#274 | 1.1%(-0.338)#11,481 |
| 8. | 98408 | 0.73% | 1.3%(-0.576)#280 | 1.1%(-0.356)#11,663 |
| 9. | 98445 | 0.68% | 1.3%(-0.629)#292 | 1.1%(-0.409)#12,272 |
| 10. | 98446 | 0.67% | 1.3%(-0.641)#297 | 1.1%(-0.421)#12,408 |
| 11. | 98433 | 0.63% | 1.3%(-0.677)#308 | 1.1%(-0.457)#12,856 |
| 12. | 98404 | 0.56% | 1.3%(-0.752)#324 | 1.1%(-0.532)#13,785 |
| 13. | 98444 | 0.49% | 1.3%(-0.820)#338 | 1.1%(-0.600)#14,622 |
| 14. | 98402 | 0.36% | 1.3%(-0.953)#361 | 1.1%(-0.733)#16,315 |
| 15. | 98465 | 0.30% | 1.3%(-1.01)#372 | 1.1%(-0.789)#17,032 |
1
Common Questions
What are the Top 10 Zip Codes with the Highest Percentage of Population Employed in Life, Physical & Social Science in Tacoma, WA?
Top 10 Zip Codes with the Highest Percentage of Population Employed in Life, Physical & Social Science in Tacoma, WA are:
What zip code has the Highest Percentage of Population Employed in Life, Physical & Social Science in Tacoma, WA?
98403 has the Highest Percentage of Population Employed in Life, Physical & Social Science in Tacoma, WA with 3.8%.
What is the Percentage of Population Employed in Life, Physical & Social Science in Tacoma, WA?
Percentage of Population Employed in Life, Physical & Social Science in Tacoma is 0.98%.
What is the Percentage of Population Employed in Life, Physical & Social Science in Washington?
Percentage of Population Employed in Life, Physical & Social Science in Washington is 1.3%.
What is the Percentage of Population Employed in Life, Physical & Social Science in the United States?
Percentage of Population Employed in Life, Physical & Social Science in the United States is 1.1%.