Zip Codes with the Highest Percentage of Population with a Degree in Visual and Performing Arts in Renton, WA
RELATED REPORTS & OPTIONS
Visual and Performing Arts
Renton
Compare Zip Codes
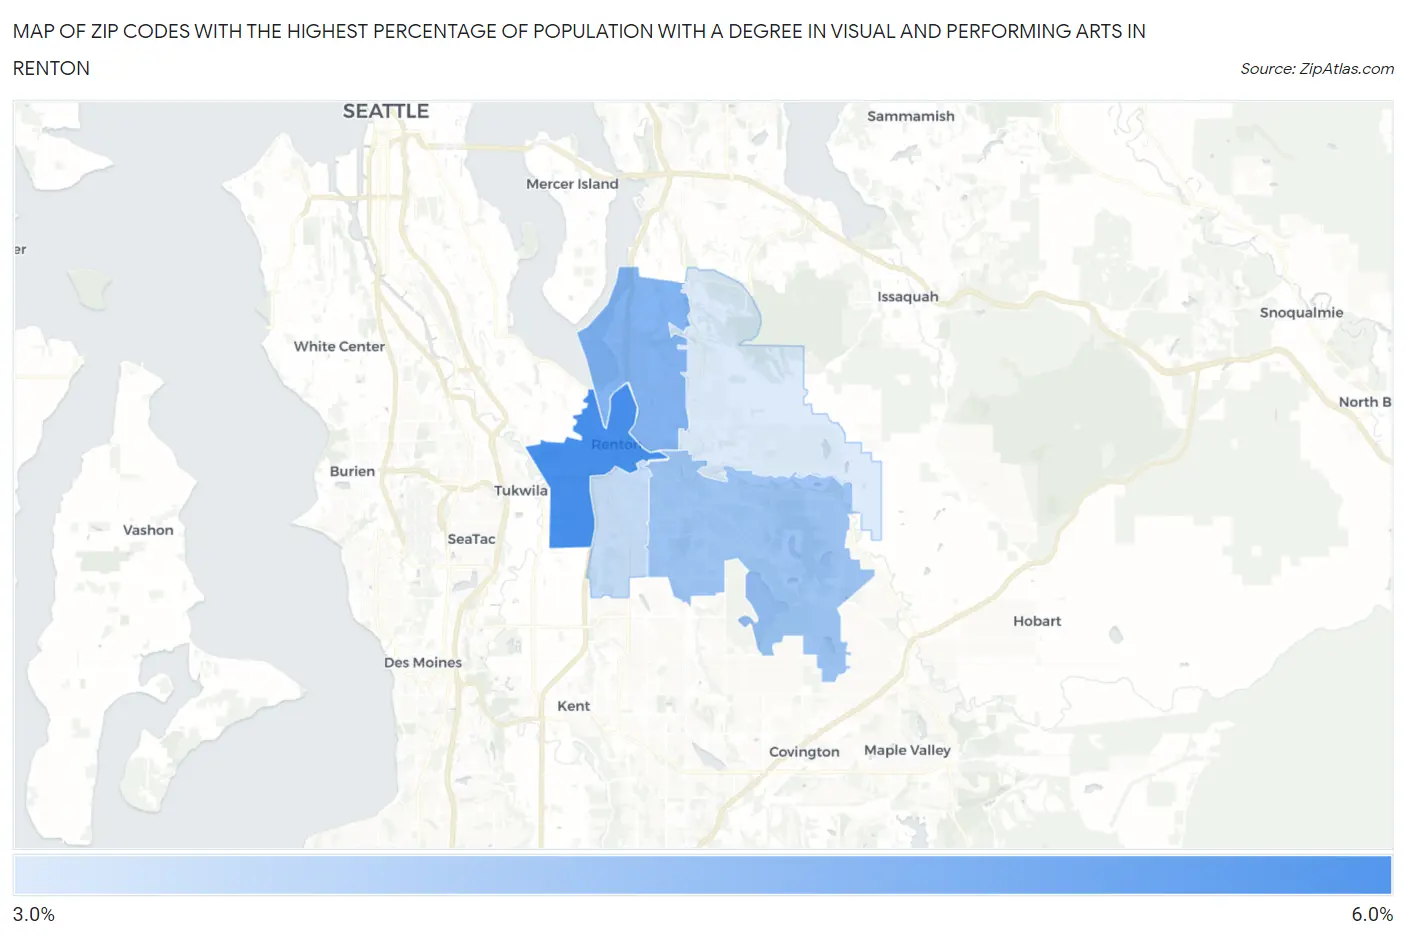
Map of Zip Codes with the Highest Percentage of Population with a Degree in Visual and Performing Arts in Renton
3.1%
6.0%
Zip Codes with the Highest Percentage of Population with a Degree in Visual and Performing Arts in Renton, WA
| Zip Code | % Graduates | vs State | vs National | |
| 1. | 98057 | 6.0% | 4.6%(+1.35)#123 | 4.3%(+1.72)#4,919 |
| 2. | 98056 | 4.8% | 4.6%(+0.191)#187 | 4.3%(+0.558)#7,054 |
| 3. | 98058 | 4.3% | 4.6%(-0.313)#217 | 4.3%(+0.054)#8,339 |
| 4. | 98055 | 3.6% | 4.6%(-1.05)#269 | 4.3%(-0.688)#10,638 |
| 5. | 98059 | 3.1% | 4.6%(-1.49)#307 | 4.3%(-1.12)#12,223 |
1
Common Questions
What are the Top 3 Zip Codes with the Highest Percentage of Population with a Degree in Visual and Performing Arts in Renton, WA?
Top 3 Zip Codes with the Highest Percentage of Population with a Degree in Visual and Performing Arts in Renton, WA are:
What zip code has the Highest Percentage of Population with a Degree in Visual and Performing Arts in Renton, WA?
98057 has the Highest Percentage of Population with a Degree in Visual and Performing Arts in Renton, WA with 6.0%.
What is the Percentage of Population with a Degree in Visual and Performing Arts in Renton, WA?
Percentage of Population with a Degree in Visual and Performing Arts in Renton is 4.7%.
What is the Percentage of Population with a Degree in Visual and Performing Arts in Washington?
Percentage of Population with a Degree in Visual and Performing Arts in Washington is 4.6%.
What is the Percentage of Population with a Degree in Visual and Performing Arts in the United States?
Percentage of Population with a Degree in Visual and Performing Arts in the United States is 4.3%.