Zip Codes with the Highest Percentage of Population Employed in Administrative & Support Services in Tacoma, WA
RELATED REPORTS & OPTIONS
Administrative & Support Services
Tacoma
Compare Zip Codes
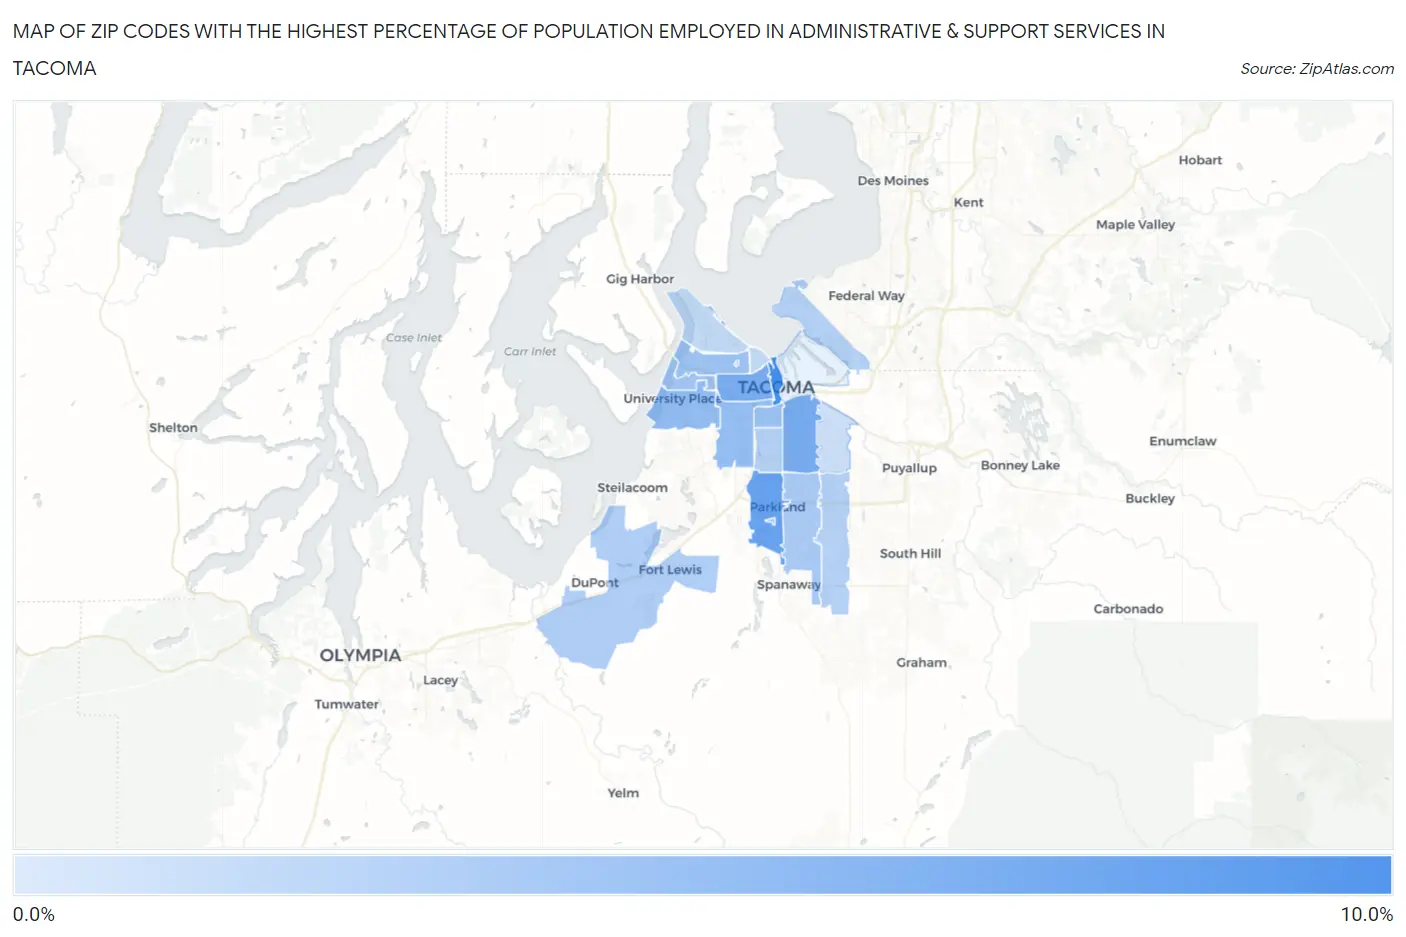
Map of Zip Codes with the Highest Percentage of Population Employed in Administrative & Support Services in Tacoma
1.1%
8.0%
Zip Codes with the Highest Percentage of Population Employed in Administrative & Support Services in Tacoma, WA
| Zip Code | % Employed | vs State | vs National | |
| 1. | 98402 | 8.0% | 3.8%(+4.25)#30 | 4.1%(+3.87)#2,261 |
| 2. | 98444 | 6.4% | 3.8%(+2.66)#65 | 4.1%(+2.27)#4,034 |
| 3. | 98404 | 5.8% | 3.8%(+2.01)#81 | 4.1%(+1.63)#5,201 |
| 4. | 98405 | 5.6% | 3.8%(+1.83)#84 | 4.1%(+1.45)#5,591 |
| 5. | 98466 | 4.5% | 3.8%(+0.724)#146 | 4.1%(+0.339)#8,754 |
| 6. | 98409 | 4.4% | 3.8%(+0.594)#155 | 4.1%(+0.210)#9,241 |
| 7. | 98418 | 4.1% | 3.8%(+0.379)#180 | 4.1%(-0.005)#10,064 |
| 8. | 98406 | 4.0% | 3.8%(+0.192)#195 | 4.1%(-0.192)#10,870 |
| 9. | 98465 | 3.8% | 3.8%(-0.012)#220 | 4.1%(-0.396)#11,738 |
| 10. | 98447 | 3.6% | 3.8%(-0.162)#237 | 4.1%(-0.546)#12,462 |
| 11. | 98445 | 3.4% | 3.8%(-0.401)#267 | 4.1%(-0.785)#13,623 |
| 12. | 98433 | 3.1% | 3.8%(-0.633)#282 | 4.1%(-1.02)#14,820 |
| 13. | 98422 | 2.9% | 3.8%(-0.865)#316 | 4.1%(-1.25)#15,990 |
| 14. | 98446 | 2.9% | 3.8%(-0.904)#322 | 4.1%(-1.29)#16,194 |
| 15. | 98408 | 2.8% | 3.8%(-0.922)#325 | 4.1%(-1.31)#16,296 |
| 16. | 98403 | 2.3% | 3.8%(-1.49)#382 | 4.1%(-1.87)#19,296 |
| 17. | 98407 | 2.2% | 3.8%(-1.53)#387 | 4.1%(-1.91)#19,481 |
| 18. | 98443 | 1.8% | 3.8%(-1.97)#425 | 4.1%(-2.36)#21,566 |
| 19. | 98416 | 1.1% | 3.8%(-2.66)#455 | 4.1%(-3.05)#24,179 |
1
Common Questions
What are the Top 10 Zip Codes with the Highest Percentage of Population Employed in Administrative & Support Services in Tacoma, WA?
Top 10 Zip Codes with the Highest Percentage of Population Employed in Administrative & Support Services in Tacoma, WA are:
What zip code has the Highest Percentage of Population Employed in Administrative & Support Services in Tacoma, WA?
98402 has the Highest Percentage of Population Employed in Administrative & Support Services in Tacoma, WA with 8.0%.
What is the Percentage of Population Employed in Administrative & Support Services in Tacoma, WA?
Percentage of Population Employed in Administrative & Support Services in Tacoma is 4.0%.
What is the Percentage of Population Employed in Administrative & Support Services in Washington?
Percentage of Population Employed in Administrative & Support Services in Washington is 3.8%.
What is the Percentage of Population Employed in Administrative & Support Services in the United States?
Percentage of Population Employed in Administrative & Support Services in the United States is 4.1%.