Tohono O'odham vs Immigrants from Russia 4 or more Vehicles in Household
COMPARE
Tohono O'odham
Immigrants from Russia
4 or more Vehicles in Household
4 or more Vehicles in Household Comparison
Tohono O'odham
Immigrants from Russia
6.6%
4 OR MORE VEHICLES IN HOUSEHOLD
86.7/ 100
METRIC RATING
135th/ 347
METRIC RANK
5.3%
4 OR MORE VEHICLES IN HOUSEHOLD
0.2/ 100
METRIC RATING
290th/ 347
METRIC RANK
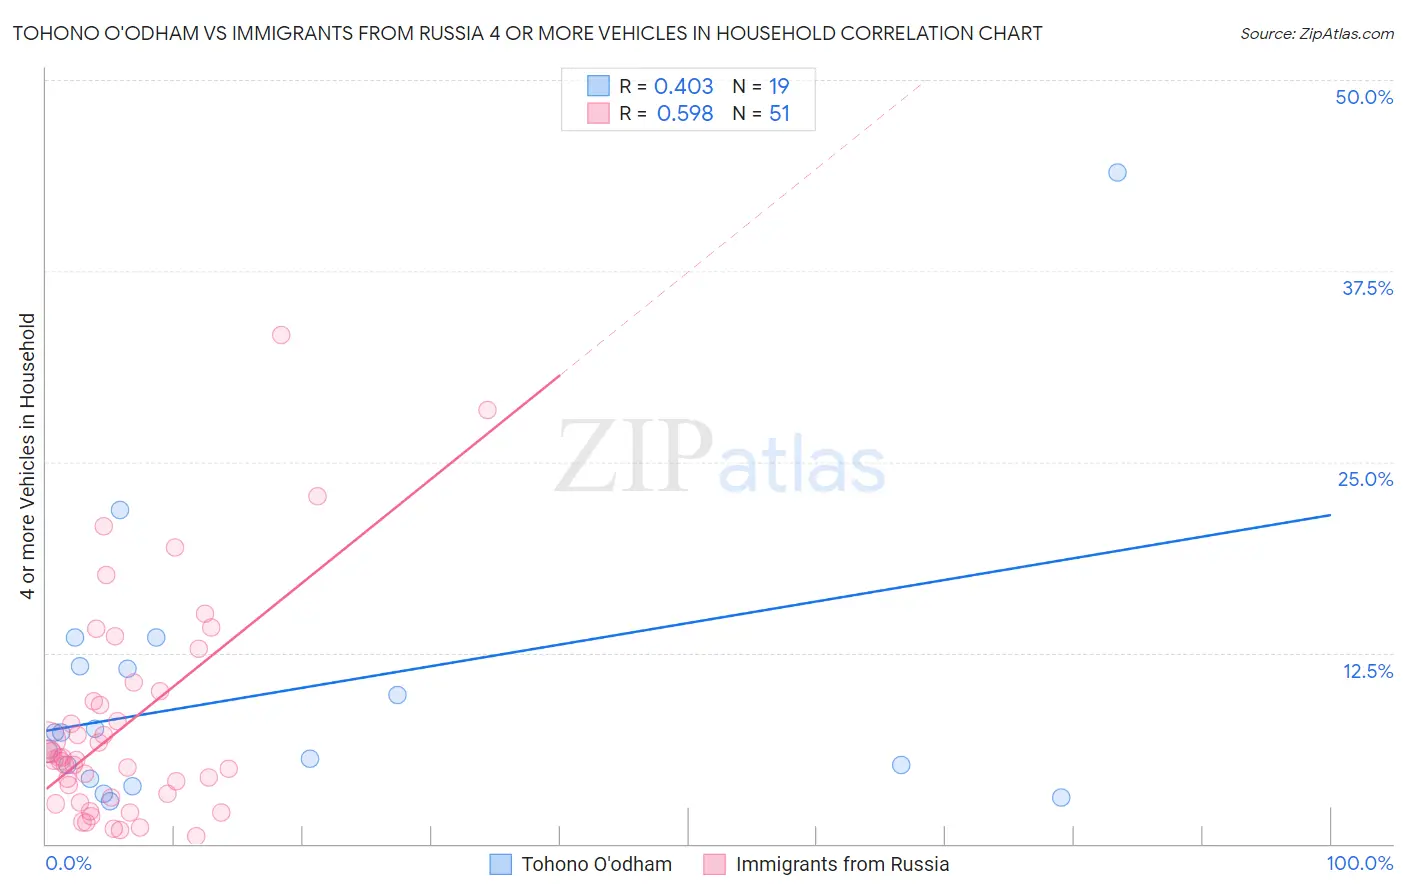
Tohono O'odham vs Immigrants from Russia 4 or more Vehicles in Household Correlation Chart
The statistical analysis conducted on geographies consisting of 58,702,005 people shows a moderate positive correlation between the proportion of Tohono O'odham and percentage of households with 4 or more vehicles available in the United States with a correlation coefficient (R) of 0.403 and weighted average of 6.6%. Similarly, the statistical analysis conducted on geographies consisting of 346,141,133 people shows a substantial positive correlation between the proportion of Immigrants from Russia and percentage of households with 4 or more vehicles available in the United States with a correlation coefficient (R) of 0.598 and weighted average of 5.3%, a difference of 24.6%.
4 or more Vehicles in Household Correlation Summary
| Measurement | Tohono O'odham | Immigrants from Russia |
| Minimum | 2.8% | 0.50% |
| Maximum | 43.9% | 33.3% |
| Range | 41.1% | 32.8% |
| Mean | 9.8% | 7.9% |
| Median | 7.3% | 5.5% |
| Interquartile 25% (IQ1) | 4.3% | 3.0% |
| Interquartile 75% (IQ3) | 11.6% | 9.9% |
| Interquartile Range (IQR) | 7.3% | 6.9% |
| Standard Deviation (Sample) | 9.5% | 7.1% |
| Standard Deviation (Population) | 9.3% | 7.1% |
Similar Demographics by 4 or more Vehicles in Household
Demographics Similar to Tohono O'odham by 4 or more Vehicles in Household
In terms of 4 or more vehicles in household, the demographic groups most similar to Tohono O'odham are Ottawa (6.6%, a difference of 0.030%), Armenian (6.6%, a difference of 0.050%), Luxembourger (6.6%, a difference of 0.070%), Immigrants from Netherlands (6.6%, a difference of 0.24%), and French Canadian (6.6%, a difference of 0.27%).
| Demographics | Rating | Rank | 4 or more Vehicles in Household |
| Immigrants | Bolivia | 92.5 /100 | #128 | Exceptional 6.7% |
| Immigrants | England | 92.0 /100 | #129 | Exceptional 6.7% |
| Immigrants | Scotland | 89.0 /100 | #130 | Excellent 6.7% |
| Maltese | 88.4 /100 | #131 | Excellent 6.7% |
| Immigrants | Netherlands | 87.8 /100 | #132 | Excellent 6.6% |
| Armenians | 86.9 /100 | #133 | Excellent 6.6% |
| Ottawa | 86.9 /100 | #134 | Excellent 6.6% |
| Tohono O'odham | 86.7 /100 | #135 | Excellent 6.6% |
| Luxembourgers | 86.4 /100 | #136 | Excellent 6.6% |
| French Canadians | 85.4 /100 | #137 | Excellent 6.6% |
| Italians | 84.5 /100 | #138 | Excellent 6.6% |
| Jordanians | 82.1 /100 | #139 | Excellent 6.6% |
| Slavs | 81.6 /100 | #140 | Excellent 6.6% |
| Australians | 80.8 /100 | #141 | Excellent 6.6% |
| Immigrants | Iraq | 79.4 /100 | #142 | Good 6.5% |
Demographics Similar to Immigrants from Russia by 4 or more Vehicles in Household
In terms of 4 or more vehicles in household, the demographic groups most similar to Immigrants from Russia are Immigrants from Bosnia and Herzegovina (5.3%, a difference of 0.30%), Venezuelan (5.3%, a difference of 0.44%), Immigrants from Croatia (5.4%, a difference of 0.63%), Immigrants from Colombia (5.4%, a difference of 0.72%), and Immigrants from Liberia (5.4%, a difference of 0.76%).
| Demographics | Rating | Rank | 4 or more Vehicles in Household |
| Immigrants | Ireland | 0.3 /100 | #283 | Tragic 5.4% |
| Brazilians | 0.3 /100 | #284 | Tragic 5.4% |
| Immigrants | Liberia | 0.2 /100 | #285 | Tragic 5.4% |
| Immigrants | Colombia | 0.2 /100 | #286 | Tragic 5.4% |
| Immigrants | Croatia | 0.2 /100 | #287 | Tragic 5.4% |
| Venezuelans | 0.2 /100 | #288 | Tragic 5.3% |
| Immigrants | Bosnia and Herzegovina | 0.2 /100 | #289 | Tragic 5.3% |
| Immigrants | Russia | 0.2 /100 | #290 | Tragic 5.3% |
| Immigrants | Bahamas | 0.1 /100 | #291 | Tragic 5.3% |
| Liberians | 0.1 /100 | #292 | Tragic 5.3% |
| Immigrants | Congo | 0.1 /100 | #293 | Tragic 5.2% |
| Ghanaians | 0.1 /100 | #294 | Tragic 5.2% |
| Immigrants | Brazil | 0.1 /100 | #295 | Tragic 5.2% |
| Israelis | 0.1 /100 | #296 | Tragic 5.2% |
| Immigrants | Venezuela | 0.1 /100 | #297 | Tragic 5.2% |