Tohono O'odham vs Trinidadian and Tobagonian 4 or more Vehicles in Household
COMPARE
Tohono O'odham
Trinidadian and Tobagonian
4 or more Vehicles in Household
4 or more Vehicles in Household Comparison
Tohono O'odham
Trinidadians and Tobagonians
6.6%
4 OR MORE VEHICLES IN HOUSEHOLD
86.7/ 100
METRIC RATING
135th/ 347
METRIC RANK
4.3%
4 OR MORE VEHICLES IN HOUSEHOLD
0.0/ 100
METRIC RATING
328th/ 347
METRIC RANK
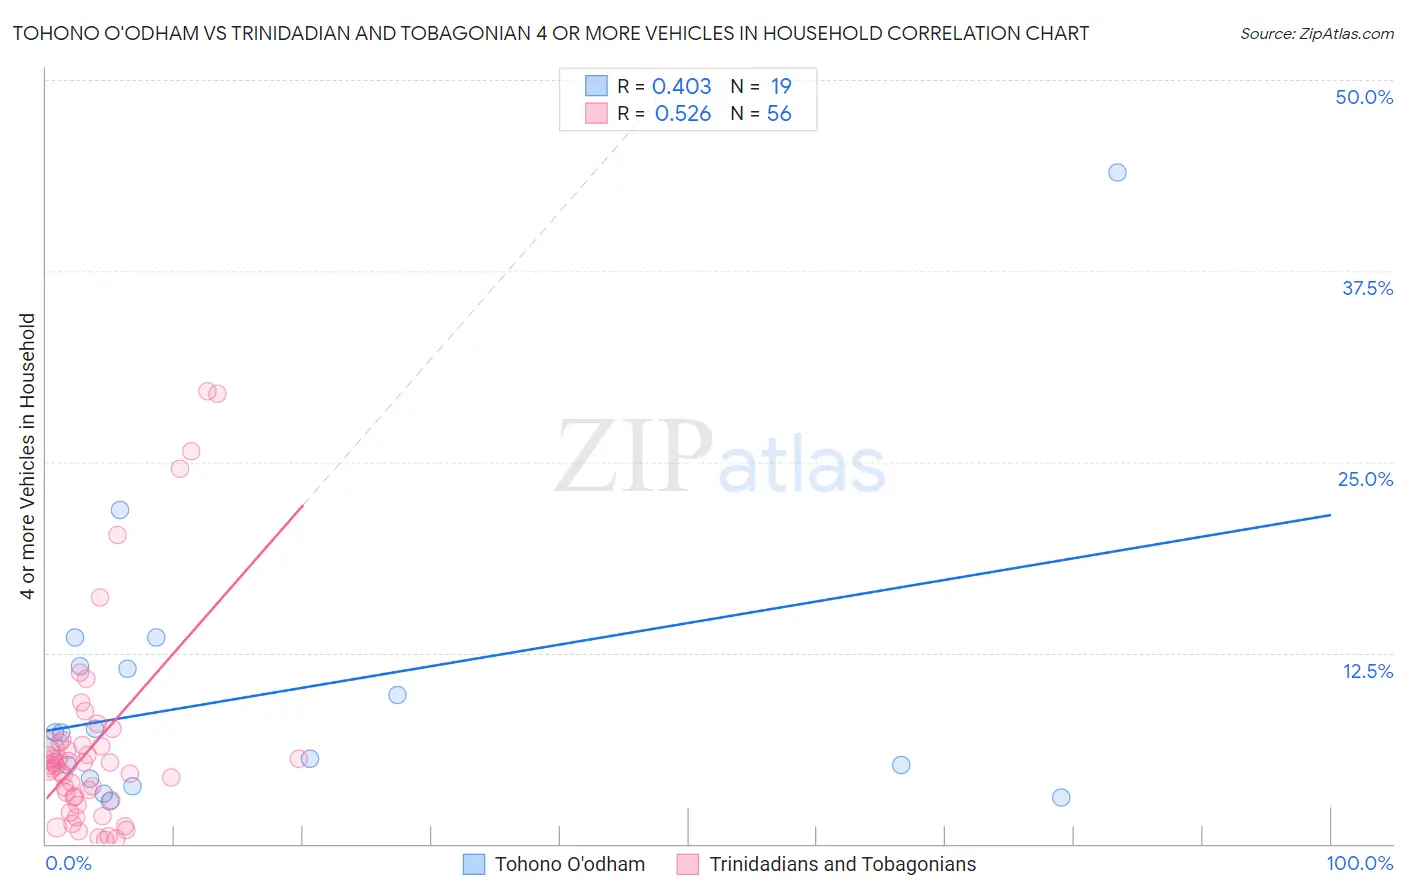
Tohono O'odham vs Trinidadian and Tobagonian 4 or more Vehicles in Household Correlation Chart
The statistical analysis conducted on geographies consisting of 58,702,005 people shows a moderate positive correlation between the proportion of Tohono O'odham and percentage of households with 4 or more vehicles available in the United States with a correlation coefficient (R) of 0.403 and weighted average of 6.6%. Similarly, the statistical analysis conducted on geographies consisting of 218,579,847 people shows a substantial positive correlation between the proportion of Trinidadians and Tobagonians and percentage of households with 4 or more vehicles available in the United States with a correlation coefficient (R) of 0.526 and weighted average of 4.3%, a difference of 55.8%.
4 or more Vehicles in Household Correlation Summary
| Measurement | Tohono O'odham | Trinidadian and Tobagonian |
| Minimum | 2.8% | 0.23% |
| Maximum | 43.9% | 29.6% |
| Range | 41.1% | 29.4% |
| Mean | 9.8% | 6.6% |
| Median | 7.3% | 5.1% |
| Interquartile 25% (IQ1) | 4.3% | 3.0% |
| Interquartile 75% (IQ3) | 11.6% | 6.6% |
| Interquartile Range (IQR) | 7.3% | 3.6% |
| Standard Deviation (Sample) | 9.5% | 6.8% |
| Standard Deviation (Population) | 9.3% | 6.8% |
Similar Demographics by 4 or more Vehicles in Household
Demographics Similar to Tohono O'odham by 4 or more Vehicles in Household
In terms of 4 or more vehicles in household, the demographic groups most similar to Tohono O'odham are Ottawa (6.6%, a difference of 0.030%), Armenian (6.6%, a difference of 0.050%), Luxembourger (6.6%, a difference of 0.070%), Immigrants from Netherlands (6.6%, a difference of 0.24%), and French Canadian (6.6%, a difference of 0.27%).
| Demographics | Rating | Rank | 4 or more Vehicles in Household |
| Immigrants | Bolivia | 92.5 /100 | #128 | Exceptional 6.7% |
| Immigrants | England | 92.0 /100 | #129 | Exceptional 6.7% |
| Immigrants | Scotland | 89.0 /100 | #130 | Excellent 6.7% |
| Maltese | 88.4 /100 | #131 | Excellent 6.7% |
| Immigrants | Netherlands | 87.8 /100 | #132 | Excellent 6.6% |
| Armenians | 86.9 /100 | #133 | Excellent 6.6% |
| Ottawa | 86.9 /100 | #134 | Excellent 6.6% |
| Tohono O'odham | 86.7 /100 | #135 | Excellent 6.6% |
| Luxembourgers | 86.4 /100 | #136 | Excellent 6.6% |
| French Canadians | 85.4 /100 | #137 | Excellent 6.6% |
| Italians | 84.5 /100 | #138 | Excellent 6.6% |
| Jordanians | 82.1 /100 | #139 | Excellent 6.6% |
| Slavs | 81.6 /100 | #140 | Excellent 6.6% |
| Australians | 80.8 /100 | #141 | Excellent 6.6% |
| Immigrants | Iraq | 79.4 /100 | #142 | Good 6.5% |
Demographics Similar to Trinidadians and Tobagonians by 4 or more Vehicles in Household
In terms of 4 or more vehicles in household, the demographic groups most similar to Trinidadians and Tobagonians are Immigrants from Senegal (4.2%, a difference of 0.27%), Immigrants from Ecuador (4.2%, a difference of 0.47%), West Indian (4.2%, a difference of 0.73%), Senegalese (4.3%, a difference of 1.6%), and Immigrants from Dominica (4.2%, a difference of 1.6%).
| Demographics | Rating | Rank | 4 or more Vehicles in Household |
| Ecuadorians | 0.0 /100 | #321 | Tragic 4.5% |
| Immigrants | Yemen | 0.0 /100 | #322 | Tragic 4.5% |
| Immigrants | Caribbean | 0.0 /100 | #323 | Tragic 4.4% |
| Soviet Union | 0.0 /100 | #324 | Tragic 4.4% |
| Immigrants | Jamaica | 0.0 /100 | #325 | Tragic 4.4% |
| Cape Verdeans | 0.0 /100 | #326 | Tragic 4.4% |
| Senegalese | 0.0 /100 | #327 | Tragic 4.3% |
| Trinidadians and Tobagonians | 0.0 /100 | #328 | Tragic 4.3% |
| Immigrants | Senegal | 0.0 /100 | #329 | Tragic 4.2% |
| Immigrants | Ecuador | 0.0 /100 | #330 | Tragic 4.2% |
| West Indians | 0.0 /100 | #331 | Tragic 4.2% |
| Immigrants | Dominica | 0.0 /100 | #332 | Tragic 4.2% |
| Immigrants | Albania | 0.0 /100 | #333 | Tragic 4.1% |
| Immigrants | Trinidad and Tobago | 0.0 /100 | #334 | Tragic 4.1% |
| Barbadians | 0.0 /100 | #335 | Tragic 3.9% |