Iroquois vs Immigrants from Belgium 1 or more Vehicles in Household

COMPARE

Iroquois
Race
Ancestry
AfghanAfricanAlaska NativeAlaskan AthabascanAlbanianAleutAlsatianAmericanApacheArabArapahoArgentineanArmenianAssyrian/Chaldean/SyriacAustralianAustrianBahamianBangladeshiBarbadianBasqueBelgianBelizeanBermudanBhutaneseBlackfeetBolivianBrazilianBritishBritish West IndianBulgarianBurmeseCajunCambodianCanadianCape VerdeanCarpatho RusynCelticCentral AmericanCentral American IndianCherokeeCheyenneChickasawChileanChineseChippewaChoctawColombianColvilleComancheCosta RicanCreeCreekCroatianCrowCubanCypriotCzechCzechoslovakianDanishDelawareDominicanDutchDutch West IndianEastern EuropeanEcuadorianEgyptianEnglishEstonianEthiopianEuropeanFijianFilipinoFinnishFrenchFrench American IndianFrench CanadianGermanGerman RussianGhanaianGreekGuamanian/ChamorroGuatemalanGuyaneseHaitianHmongHonduranHopiHoumaHungarianIcelanderIndian (Asian)IndonesianInupiatIranianIraqiIrishIroquoisIsraeliItalianJamaicanJapaneseJordanianKenyanKiowaKoreanLaotianLatvianLebaneseLiberianLithuanianLumbeeLuxembourgerMacedonianMalaysianMalteseMarshalleseMenomineeMexicanMexican American IndianMongolianMoroccanNative HawaiianNavajoNepaleseNew ZealanderNicaraguanNigerianNorthern EuropeanNorwegianOkinawanOsageOttawaPaiutePakistaniPalestinianPanamanianParaguayanPennsylvania GermanPeruvianPimaPolishPortuguesePotawatomiPuebloPuerto RicanPuget Sound SalishRomanianRussianSalvadoranSamoanScandinavianScotch-IrishScottishSeminoleSenegaleseSerbianShoshoneSierra LeoneanSiouxSlavicSlovakSloveneSomaliSouth AfricanSouth AmericanSouth American IndianSoviet UnionSpaniardSpanishSpanish AmericanSpanish American IndianSri LankanSubsaharan AfricanSudaneseSwedishSwissSyrianTaiwaneseThaiTlingit-HaidaTohono O'OdhamTonganTrinidadian and TobagonianTsimshianTurkishU.S. Virgin IslanderUgandanUkrainianUruguayanUteVenezuelanVietnameseWelshWest IndianYakamaYaquiYugoslavianYumanYup'ikZimbabwean
Immigration
NonimmigrantsImmigrantsAfghanistanAfricaAlbaniaArgentinaArmeniaAsiaAustraliaAustriaBahamasBangladeshBarbadosBelarusBelizeBoliviaBosnia and HerzegovinaBrazilBulgariaBurma/MyanmarCabo VerdeCambodiaCameroonCanadaCaribbeanCentral AmericaChileChinaColombiaCongoCosta RicaCroatiaCubaCzechoslovakiaDenmarkDominicaDominican RepublicEastern AfricaEastern AsiaEastern EuropeEcuadorEgyptEl SalvadorEnglandEritreaEthiopiaEuropeFijiFranceGermanyGhanaGreeceGrenadaGuatemalaGuyanaHaitiHondurasHong KongHungaryIndiaIndonesiaIranIraqIrelandIsraelItalyJamaicaJapanJordanKazakhstanKenyaKoreaKuwaitLaosLatin AmericaLatviaLebanonLiberiaLithuaniaMalaysiaMexicoMicronesiaMiddle AfricaMoldovaMoroccoNepalNetherlandsNicaraguaNigeriaNorth AmericaNorth MacedoniaNorthern AfricaNorthern EuropeNorwayOceaniaPakistanPanamaPeruPhilippinesPolandPortugalRomaniaRussiaSaudi ArabiaScotlandSenegalSerbiaSierra LeoneSingaporeSomaliaSouth AfricaSouth AmericaSouth Central AsiaSouth Eastern AsiaSouthern EuropeSpainSri LankaSt. Vincent and the GrenadinesSudanSwedenSwitzerlandSyriaTaiwanThailandTrinidad and TobagoTurkeyUgandaUkraineUruguayUzbekistanVenezuelaVietnamWest IndiesWestern AfricaWestern AsiaWestern EuropeYemenZaireZimbabweAzores
Immigrants from Belgium
Race
Ancestry
AfghanAfricanAlaska NativeAlaskan AthabascanAlbanianAleutAlsatianAmericanApacheArabArapahoArgentineanArmenianAssyrian/Chaldean/SyriacAustralianAustrianBahamianBangladeshiBarbadianBasqueBelgianBelizeanBermudanBhutaneseBlackfeetBolivianBrazilianBritishBritish West IndianBulgarianBurmeseCajunCambodianCanadianCape VerdeanCarpatho RusynCelticCentral AmericanCentral American IndianCherokeeCheyenneChickasawChileanChineseChippewaChoctawColombianColvilleComancheCosta RicanCreeCreekCroatianCrowCubanCypriotCzechCzechoslovakianDanishDelawareDominicanDutchDutch West IndianEastern EuropeanEcuadorianEgyptianEnglishEstonianEthiopianEuropeanFijianFilipinoFinnishFrenchFrench American IndianFrench CanadianGermanGerman RussianGhanaianGreekGuamanian/ChamorroGuatemalanGuyaneseHaitianHmongHonduranHopiHoumaHungarianIcelanderIndian (Asian)IndonesianInupiatIranianIraqiIrishIsraeliItalianJamaicanJapaneseJordanianKenyanKiowaKoreanLaotianLatvianLebaneseLiberianLithuanianLumbeeLuxembourgerMacedonianMalaysianMalteseMarshalleseMenomineeMexicanMexican American IndianMongolianMoroccanNative HawaiianNavajoNepaleseNew ZealanderNicaraguanNigerianNorthern EuropeanNorwegianOkinawanOsageOttawaPaiutePakistaniPalestinianPanamanianParaguayanPennsylvania GermanPeruvianPimaPolishPortuguesePotawatomiPuebloPuerto RicanPuget Sound SalishRomanianRussianSalvadoranSamoanScandinavianScotch-IrishScottishSeminoleSenegaleseSerbianShoshoneSierra LeoneanSiouxSlavicSlovakSloveneSomaliSouth AfricanSouth AmericanSouth American IndianSoviet UnionSpaniardSpanishSpanish AmericanSpanish American IndianSri LankanSubsaharan AfricanSudaneseSwedishSwissSyrianTaiwaneseThaiTlingit-HaidaTohono O'OdhamTonganTrinidadian and TobagonianTsimshianTurkishU.S. Virgin IslanderUgandanUkrainianUruguayanUteVenezuelanVietnameseWelshWest IndianYakamaYaquiYugoslavianYumanYup'ikZimbabwean
Immigration
NonimmigrantsImmigrantsAfghanistanAfricaAlbaniaArgentinaArmeniaAsiaAustraliaAustriaBahamasBangladeshBarbadosBelarusBelgiumBelizeBoliviaBosnia and HerzegovinaBrazilBulgariaBurma/MyanmarCabo VerdeCambodiaCameroonCanadaCaribbeanCentral AmericaChileChinaColombiaCongoCosta RicaCroatiaCubaCzechoslovakiaDenmarkDominicaDominican RepublicEastern AfricaEastern AsiaEastern EuropeEcuadorEgyptEl SalvadorEnglandEritreaEthiopiaEuropeFijiFranceGermanyGhanaGreeceGrenadaGuatemalaGuyanaHaitiHondurasHong KongHungaryIndiaIndonesiaIranIraqIrelandIsraelItalyJamaicaJapanJordanKazakhstanKenyaKoreaKuwaitLaosLatin AmericaLatviaLebanonLiberiaLithuaniaMalaysiaMexicoMicronesiaMiddle AfricaMoldovaMoroccoNepalNetherlandsNicaraguaNigeriaNorth AmericaNorth MacedoniaNorthern AfricaNorthern EuropeNorwayOceaniaPakistanPanamaPeruPhilippinesPolandPortugalRomaniaRussiaSaudi ArabiaScotlandSenegalSerbiaSierra LeoneSingaporeSomaliaSouth AfricaSouth AmericaSouth Central AsiaSouth Eastern AsiaSouthern EuropeSpainSri LankaSt. Vincent and the GrenadinesSudanSwedenSwitzerlandSyriaTaiwanThailandTrinidad and TobagoTurkeyUgandaUkraineUruguayUzbekistanVenezuelaVietnamWest IndiesWestern AfricaWestern AsiaWestern EuropeYemenZaireZimbabweAzores
1 or more Vehicles in Household
Income
Poverty
Unemployment
Labor Participation
Family Structure
Vehicle Availability
Education Level
Disability

1 or more Vehicles in Household Comparison

Iroquois

Immigrants from Belgium

Poor
Tragic
89.2%
1 OR MORE VEHICLES IN HOUSEHOLD
19.8/ 100
METRIC RATING
202nd/ 347
METRIC RANK
88.4%
1 OR MORE VEHICLES IN HOUSEHOLD
2.1/ 100
METRIC RATING
243rd/ 347
METRIC RANK

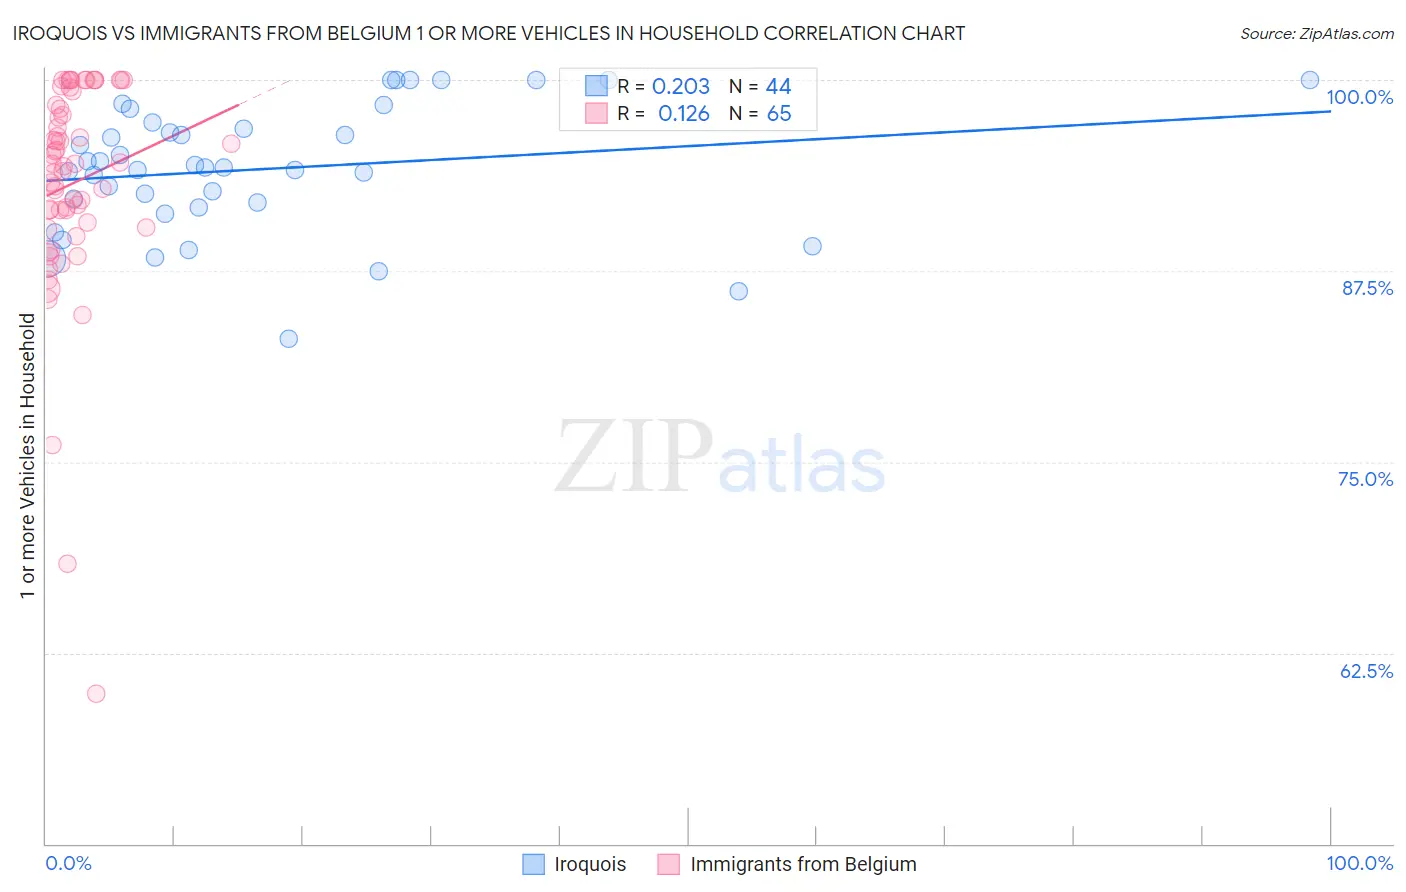
Iroquois vs Immigrants from Belgium 1 or more Vehicles in Household Correlation Chart

The statistical analysis conducted on geographies consisting of 207,261,680 people shows a weak positive correlation between the proportion of Iroquois and percentage of households with 1 or more vehicles available in the United States with a correlation coefficient (R) of 0.203 and weighted average of 89.2%. Similarly, the statistical analysis conducted on geographies consisting of 146,691,899 people shows a poor positive correlation between the proportion of Immigrants from Belgium and percentage of households with 1 or more vehicles available in the United States with a correlation coefficient (R) of 0.126 and weighted average of 88.4%, a difference of 0.96%.
Iroquois vs Immigrants from Belgium 1 or more Vehicles in Household

1 or more Vehicles in Household Correlation Summary

MeasurementIroquoisImmigrants from Belgium
Minimum83.1%59.8%
Maximum100.0%100.0%
Range16.9%40.2%
Mean94.2%93.2%
Median94.2%94.5%
Interquartile 25% (IQ1)91.8%90.5%
Interquartile 75% (IQ3)97.0%98.8%
Interquartile Range (IQR)5.2%8.4%
Standard Deviation (Sample)4.2%7.2%
Standard Deviation (Population)4.1%7.2%

Similar Demographics by 1 or more Vehicles in Household

Demographics Similar to Iroquois by 1 or more Vehicles in Household

In terms of 1 or more vehicles in household, the demographic groups most similar to Iroquois are Immigrants from Western Europe (89.2%, a difference of 0.020%), Cambodian (89.2%, a difference of 0.020%), Central American (89.2%, a difference of 0.040%), Romanian (89.2%, a difference of 0.040%), and Guatemalan (89.2%, a difference of 0.050%).
DemographicsRating | Rank1 or more Vehicles in Household
Immigrants | Armenia
31.8
/100
|
#195
Fair
89.4%
Crow
24.3
/100
|
#196
Fair
89.3%
Immigrants | Sweden
23.6
/100
|
#197
Fair
89.3%
Pennsylvania Germans
22.9
/100
|
#198
Fair
89.3%
Immigrants | Asia
22.8
/100
|
#199
Fair
89.3%
Central Americans
21.4
/100
|
#200
Fair
89.2%
Immigrants | Western Europe
20.5
/100
|
#201
Fair
89.2%
Iroquois
19.8
/100
|
#202
Poor
89.2%
Cambodians
18.9
/100
|
#203
Poor
89.2%
Romanians
18.2
/100
|
#204
Poor
89.2%
Guatemalans
17.8
/100
|
#205
Poor
89.2%
Apache
16.2
/100
|
#206
Poor
89.1%
Immigrants | Denmark
14.8
/100
|
#207
Poor
89.1%
Immigrants | Chile
14.4
/100
|
#208
Poor
89.1%
Immigrants | Italy
14.0
/100
|
#209
Poor
89.1%

Demographics Similar to Immigrants from Belgium by 1 or more Vehicles in Household

In terms of 1 or more vehicles in household, the demographic groups most similar to Immigrants from Belgium are Immigrants from Portugal (88.3%, a difference of 0.020%), Immigrants from Czechoslovakia (88.3%, a difference of 0.040%), Menominee (88.3%, a difference of 0.050%), Turkish (88.4%, a difference of 0.060%), and Immigrants from Honduras (88.3%, a difference of 0.080%).
DemographicsRating | Rank1 or more Vehicles in Household
Immigrants | Pakistan
4.5
/100
|
#236
Tragic
88.6%
Immigrants | Turkey
4.4
/100
|
#237
Tragic
88.6%
Immigrants | Somalia
4.2
/100
|
#238
Tragic
88.6%
Kiowa
3.8
/100
|
#239
Tragic
88.6%
Eastern Europeans
3.0
/100
|
#240
Tragic
88.5%
Taiwanese
2.6
/100
|
#241
Tragic
88.4%
Turks
2.5
/100
|
#242
Tragic
88.4%
Immigrants | Belgium
2.1
/100
|
#243
Tragic
88.4%
Immigrants | Portugal
2.0
/100
|
#244
Tragic
88.3%
Immigrants | Czechoslovakia
1.9
/100
|
#245
Tragic
88.3%
Menominee
1.9
/100
|
#246
Tragic
88.3%
Immigrants | Honduras
1.7
/100
|
#247
Tragic
88.3%
Immigrants | Nigeria
1.5
/100
|
#248
Tragic
88.2%
Blacks/African Americans
1.4
/100
|
#249
Tragic
88.2%
Egyptians
1.2
/100
|
#250
Tragic
88.2%