Immigrants from Guyana vs Immigrants from Eastern Asia 1 or more Vehicles in Household

COMPARE

Immigrants from Guyana
Race
Ancestry
AfghanAfricanAlaska NativeAlaskan AthabascanAlbanianAleutAlsatianAmericanApacheArabArapahoArgentineanArmenianAssyrian/Chaldean/SyriacAustralianAustrianBahamianBangladeshiBarbadianBasqueBelgianBelizeanBermudanBhutaneseBlackfeetBolivianBrazilianBritishBritish West IndianBulgarianBurmeseCajunCambodianCanadianCape VerdeanCarpatho RusynCelticCentral AmericanCentral American IndianCherokeeCheyenneChickasawChileanChineseChippewaChoctawColombianColvilleComancheCosta RicanCreeCreekCroatianCrowCubanCypriotCzechCzechoslovakianDanishDelawareDominicanDutchDutch West IndianEastern EuropeanEcuadorianEgyptianEnglishEstonianEthiopianEuropeanFijianFilipinoFinnishFrenchFrench American IndianFrench CanadianGermanGerman RussianGhanaianGreekGuamanian/ChamorroGuatemalanGuyaneseHaitianHmongHonduranHopiHoumaHungarianIcelanderIndian (Asian)IndonesianInupiatIranianIraqiIrishIroquoisIsraeliItalianJamaicanJapaneseJordanianKenyanKiowaKoreanLaotianLatvianLebaneseLiberianLithuanianLumbeeLuxembourgerMacedonianMalaysianMalteseMarshalleseMenomineeMexicanMexican American IndianMongolianMoroccanNative HawaiianNavajoNepaleseNew ZealanderNicaraguanNigerianNorthern EuropeanNorwegianOkinawanOsageOttawaPaiutePakistaniPalestinianPanamanianParaguayanPennsylvania GermanPeruvianPimaPolishPortuguesePotawatomiPuebloPuerto RicanPuget Sound SalishRomanianRussianSalvadoranSamoanScandinavianScotch-IrishScottishSeminoleSenegaleseSerbianShoshoneSierra LeoneanSiouxSlavicSlovakSloveneSomaliSouth AfricanSouth AmericanSouth American IndianSoviet UnionSpaniardSpanishSpanish AmericanSpanish American IndianSri LankanSubsaharan AfricanSudaneseSwedishSwissSyrianTaiwaneseThaiTlingit-HaidaTohono O'OdhamTonganTrinidadian and TobagonianTsimshianTurkishU.S. Virgin IslanderUgandanUkrainianUruguayanUteVenezuelanVietnameseWelshWest IndianYakamaYaquiYugoslavianYumanYup'ikZimbabwean
Immigration
NonimmigrantsImmigrantsAfghanistanAfricaAlbaniaArgentinaArmeniaAsiaAustraliaAustriaBahamasBangladeshBarbadosBelarusBelgiumBelizeBoliviaBosnia and HerzegovinaBrazilBulgariaBurma/MyanmarCabo VerdeCambodiaCameroonCanadaCaribbeanCentral AmericaChileChinaColombiaCongoCosta RicaCroatiaCubaCzechoslovakiaDenmarkDominicaDominican RepublicEastern AfricaEastern EuropeEcuadorEgyptEl SalvadorEnglandEritreaEthiopiaEuropeFijiFranceGermanyGhanaGreeceGrenadaGuatemalaGuyanaHaitiHondurasHong KongHungaryIndiaIndonesiaIranIraqIrelandIsraelItalyJamaicaJapanJordanKazakhstanKenyaKoreaKuwaitLaosLatin AmericaLatviaLebanonLiberiaLithuaniaMalaysiaMexicoMicronesiaMiddle AfricaMoldovaMoroccoNepalNetherlandsNicaraguaNigeriaNorth AmericaNorth MacedoniaNorthern AfricaNorthern EuropeNorwayOceaniaPakistanPanamaPeruPhilippinesPolandPortugalRomaniaRussiaSaudi ArabiaScotlandSenegalSerbiaSierra LeoneSingaporeSomaliaSouth AfricaSouth AmericaSouth Central AsiaSouth Eastern AsiaSouthern EuropeSpainSri LankaSt. Vincent and the GrenadinesSudanSwedenSwitzerlandSyriaTaiwanThailandTrinidad and TobagoTurkeyUgandaUkraineUruguayUzbekistanVenezuelaVietnamWest IndiesWestern AfricaWestern AsiaWestern EuropeYemenZaireZimbabweAzores
Immigrants from Eastern Asia
Race
Ancestry
AfghanAfricanAlaska NativeAlaskan AthabascanAlbanianAleutAlsatianAmericanApacheArabArapahoArgentineanArmenianAssyrian/Chaldean/SyriacAustralianAustrianBahamianBangladeshiBarbadianBasqueBelgianBelizeanBermudanBhutaneseBlackfeetBolivianBrazilianBritishBritish West IndianBulgarianBurmeseCajunCambodianCanadianCape VerdeanCarpatho RusynCelticCentral AmericanCentral American IndianCherokeeCheyenneChickasawChileanChineseChippewaChoctawColombianColvilleComancheCosta RicanCreeCreekCroatianCrowCubanCypriotCzechCzechoslovakianDanishDelawareDominicanDutchDutch West IndianEastern EuropeanEcuadorianEgyptianEnglishEstonianEthiopianEuropeanFijianFilipinoFinnishFrenchFrench American IndianFrench CanadianGermanGerman RussianGhanaianGreekGuamanian/ChamorroGuatemalanGuyaneseHaitianHmongHonduranHopiHoumaHungarianIcelanderIndian (Asian)IndonesianInupiatIranianIraqiIrishIroquoisIsraeliItalianJamaicanJapaneseJordanianKenyanKiowaKoreanLaotianLatvianLebaneseLiberianLithuanianLumbeeLuxembourgerMacedonianMalaysianMalteseMarshalleseMenomineeMexicanMexican American IndianMongolianMoroccanNative HawaiianNavajoNepaleseNew ZealanderNicaraguanNigerianNorthern EuropeanNorwegianOkinawanOsageOttawaPaiutePakistaniPalestinianPanamanianParaguayanPennsylvania GermanPeruvianPimaPolishPortuguesePotawatomiPuebloPuerto RicanPuget Sound SalishRomanianRussianSalvadoranSamoanScandinavianScotch-IrishScottishSeminoleSenegaleseSerbianShoshoneSierra LeoneanSiouxSlavicSlovakSloveneSomaliSouth AfricanSouth AmericanSouth American IndianSoviet UnionSpaniardSpanishSpanish AmericanSpanish American IndianSri LankanSubsaharan AfricanSudaneseSwedishSwissSyrianTaiwaneseThaiTlingit-HaidaTohono O'OdhamTonganTrinidadian and TobagonianTsimshianTurkishU.S. Virgin IslanderUgandanUkrainianUruguayanUteVenezuelanVietnameseWelshWest IndianYakamaYaquiYugoslavianYumanYup'ikZimbabwean
Immigration
NonimmigrantsImmigrantsAfghanistanAfricaAlbaniaArgentinaArmeniaAsiaAustraliaAustriaBahamasBangladeshBarbadosBelarusBelgiumBelizeBoliviaBosnia and HerzegovinaBrazilBulgariaBurma/MyanmarCabo VerdeCambodiaCameroonCanadaCaribbeanCentral AmericaChileChinaColombiaCongoCosta RicaCroatiaCubaCzechoslovakiaDenmarkDominicaDominican RepublicEastern AfricaEastern AsiaEastern EuropeEcuadorEgyptEl SalvadorEnglandEritreaEthiopiaEuropeFijiFranceGermanyGhanaGreeceGrenadaGuatemalaHaitiHondurasHong KongHungaryIndiaIndonesiaIranIraqIrelandIsraelItalyJamaicaJapanJordanKazakhstanKenyaKoreaKuwaitLaosLatin AmericaLatviaLebanonLiberiaLithuaniaMalaysiaMexicoMicronesiaMiddle AfricaMoldovaMoroccoNepalNetherlandsNicaraguaNigeriaNorth AmericaNorth MacedoniaNorthern AfricaNorthern EuropeNorwayOceaniaPakistanPanamaPeruPhilippinesPolandPortugalRomaniaRussiaSaudi ArabiaScotlandSenegalSerbiaSierra LeoneSingaporeSomaliaSouth AfricaSouth AmericaSouth Central AsiaSouth Eastern AsiaSouthern EuropeSpainSri LankaSt. Vincent and the GrenadinesSudanSwedenSwitzerlandSyriaTaiwanThailandTrinidad and TobagoTurkeyUgandaUkraineUruguayUzbekistanVenezuelaVietnamWest IndiesWestern AfricaWestern AsiaWestern EuropeYemenZaireZimbabweAzores
1 or more Vehicles in Household
Income
Poverty
Unemployment
Labor Participation
Family Structure
Vehicle Availability
Education Level
Disability

1 or more Vehicles in Household Comparison

Immigrants from Guyana

Immigrants from Eastern Asia

Tragic
Tragic
70.6%
1 OR MORE VEHICLES IN HOUSEHOLD
0.0/ 100
METRIC RATING
342nd/ 347
METRIC RANK
86.5%
1 OR MORE VEHICLES IN HOUSEHOLD
0.0/ 100
METRIC RATING
286th/ 347
METRIC RANK

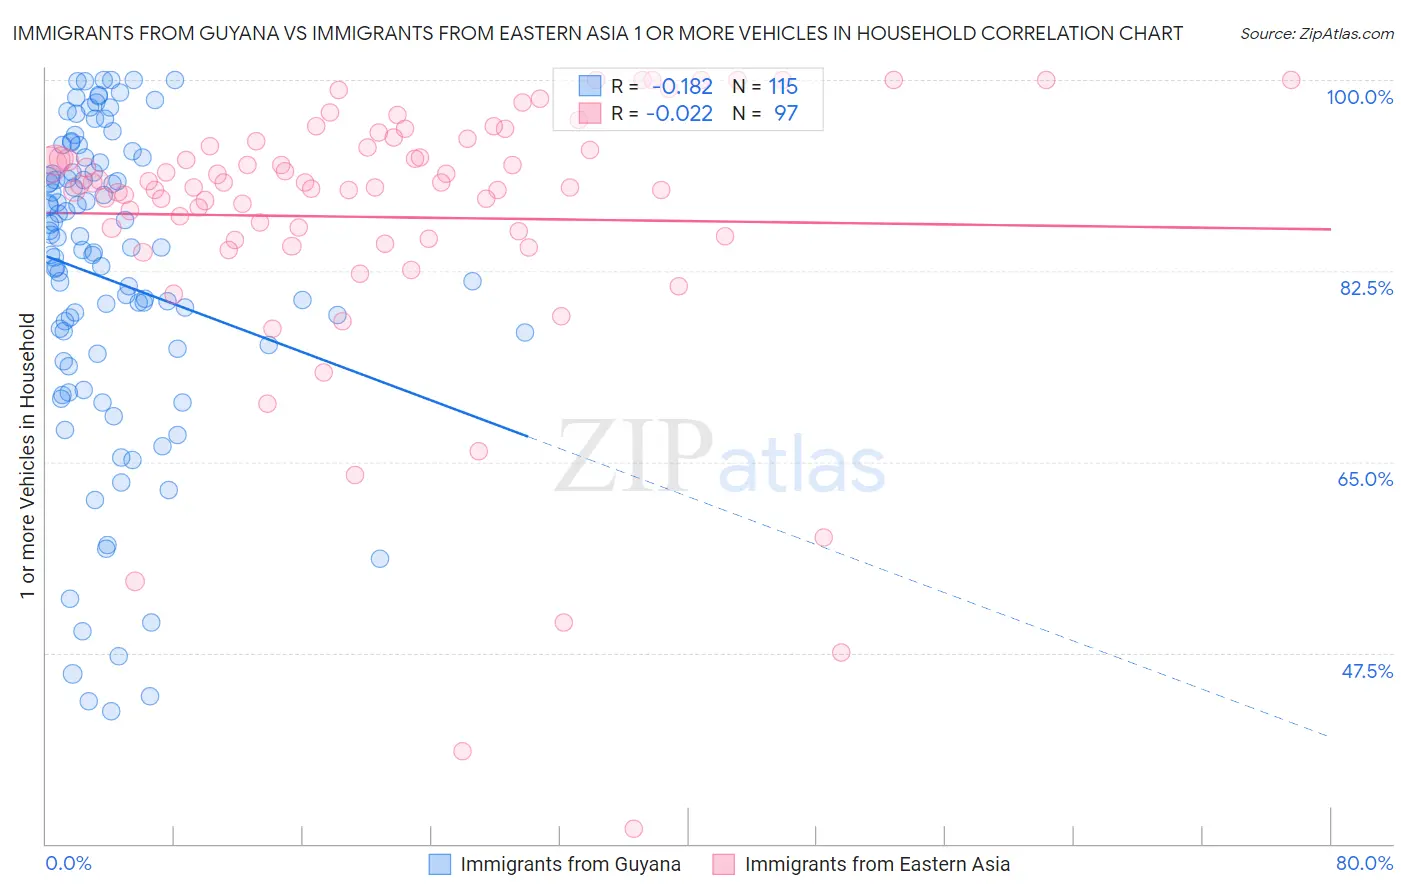
Immigrants from Guyana vs Immigrants from Eastern Asia 1 or more Vehicles in Household Correlation Chart

The statistical analysis conducted on geographies consisting of 183,508,680 people shows a poor negative correlation between the proportion of Immigrants from Guyana and percentage of households with 1 or more vehicles available in the United States with a correlation coefficient (R) of -0.182 and weighted average of 70.6%. Similarly, the statistical analysis conducted on geographies consisting of 499,412,711 people shows no correlation between the proportion of Immigrants from Eastern Asia and percentage of households with 1 or more vehicles available in the United States with a correlation coefficient (R) of -0.022 and weighted average of 86.5%, a difference of 22.6%.
Immigrants from Guyana vs Immigrants from Eastern Asia 1 or more Vehicles in Household

1 or more Vehicles in Household Correlation Summary

MeasurementImmigrants from GuyanaImmigrants from Eastern Asia
Minimum42.2%31.4%
Maximum100.0%100.0%
Range57.8%68.6%
Mean81.7%87.4%
Median84.4%90.3%
Interquartile 25% (IQ1)74.9%85.6%
Interquartile 75% (IQ3)91.6%94.1%
Interquartile Range (IQR)16.7%8.6%
Standard Deviation (Sample)14.3%12.8%
Standard Deviation (Population)14.3%12.7%

Similar Demographics by 1 or more Vehicles in Household

Demographics Similar to Immigrants from Guyana by 1 or more Vehicles in Household

In terms of 1 or more vehicles in household, the demographic groups most similar to Immigrants from Guyana are Immigrants from Barbados (70.6%, a difference of 0.010%), Dominican (70.7%, a difference of 0.15%), British West Indian (70.4%, a difference of 0.31%), Guyanese (70.8%, a difference of 0.34%), and Inupiat (71.5%, a difference of 1.4%).
DemographicsRating | Rank1 or more Vehicles in Household
Immigrants | Ecuador
0.0
/100
|
#333
Tragic
76.2%
Immigrants | Bangladesh
0.0
/100
|
#334
Tragic
74.3%
Barbadians
0.0
/100
|
#335
Tragic
74.0%
Vietnamese
0.0
/100
|
#336
Tragic
73.8%
Immigrants | Uzbekistan
0.0
/100
|
#337
Tragic
73.4%
Inupiat
0.0
/100
|
#338
Tragic
71.5%
Guyanese
0.0
/100
|
#339
Tragic
70.8%
Dominicans
0.0
/100
|
#340
Tragic
70.7%
Immigrants | Barbados
0.0
/100
|
#341
Tragic
70.6%
Immigrants | Guyana
0.0
/100
|
#342
Tragic
70.6%
British West Indians
0.0
/100
|
#343
Tragic
70.4%
Immigrants | Dominican Republic
0.0
/100
|
#344
Tragic
68.6%
Immigrants | St. Vincent and the Grenadines
0.0
/100
|
#345
Tragic
64.7%
Immigrants | Grenada
0.0
/100
|
#346
Tragic
62.7%
Yup'ik
0.0
/100
|
#347
Tragic
58.4%

Demographics Similar to Immigrants from Eastern Asia by 1 or more Vehicles in Household

In terms of 1 or more vehicles in household, the demographic groups most similar to Immigrants from Eastern Asia are Immigrants from Kazakhstan (86.6%, a difference of 0.030%), Immigrants from Malaysia (86.5%, a difference of 0.080%), Hopi (86.4%, a difference of 0.15%), Immigrants from Ireland (86.4%, a difference of 0.16%), and Immigrants from Australia (86.4%, a difference of 0.21%).
DemographicsRating | Rank1 or more Vehicles in Household
Immigrants | Albania
0.1
/100
|
#279
Tragic
87.1%
Immigrants | Croatia
0.0
/100
|
#280
Tragic
87.0%
Mongolians
0.0
/100
|
#281
Tragic
87.0%
Colville
0.0
/100
|
#282
Tragic
86.8%
Immigrants | Eastern Europe
0.0
/100
|
#283
Tragic
86.7%
Central American Indians
0.0
/100
|
#284
Tragic
86.7%
Immigrants | Kazakhstan
0.0
/100
|
#285
Tragic
86.6%
Immigrants | Eastern Asia
0.0
/100
|
#286
Tragic
86.5%
Immigrants | Malaysia
0.0
/100
|
#287
Tragic
86.5%
Hopi
0.0
/100
|
#288
Tragic
86.4%
Immigrants | Ireland
0.0
/100
|
#289
Tragic
86.4%
Immigrants | Australia
0.0
/100
|
#290
Tragic
86.4%
Pima
0.0
/100
|
#291
Tragic
86.3%
Okinawans
0.0
/100
|
#292
Tragic
86.1%
Indians (Asian)
0.0
/100
|
#293
Tragic
86.0%