Immigrants from Guyana vs Immigrants from Colombia 1 or more Vehicles in Household

COMPARE

Immigrants from Guyana
Race
Ancestry
AfghanAfricanAlaska NativeAlaskan AthabascanAlbanianAleutAlsatianAmericanApacheArabArapahoArgentineanArmenianAssyrian/Chaldean/SyriacAustralianAustrianBahamianBangladeshiBarbadianBasqueBelgianBelizeanBermudanBhutaneseBlackfeetBolivianBrazilianBritishBritish West IndianBulgarianBurmeseCajunCambodianCanadianCape VerdeanCarpatho RusynCelticCentral AmericanCentral American IndianCherokeeCheyenneChickasawChileanChineseChippewaChoctawColombianColvilleComancheCosta RicanCreeCreekCroatianCrowCubanCypriotCzechCzechoslovakianDanishDelawareDominicanDutchDutch West IndianEastern EuropeanEcuadorianEgyptianEnglishEstonianEthiopianEuropeanFijianFilipinoFinnishFrenchFrench American IndianFrench CanadianGermanGerman RussianGhanaianGreekGuamanian/ChamorroGuatemalanGuyaneseHaitianHmongHonduranHopiHoumaHungarianIcelanderIndian (Asian)IndonesianInupiatIranianIraqiIrishIroquoisIsraeliItalianJamaicanJapaneseJordanianKenyanKiowaKoreanLaotianLatvianLebaneseLiberianLithuanianLumbeeLuxembourgerMacedonianMalaysianMalteseMarshalleseMenomineeMexicanMexican American IndianMongolianMoroccanNative HawaiianNavajoNepaleseNew ZealanderNicaraguanNigerianNorthern EuropeanNorwegianOkinawanOsageOttawaPaiutePakistaniPalestinianPanamanianParaguayanPennsylvania GermanPeruvianPimaPolishPortuguesePotawatomiPuebloPuerto RicanPuget Sound SalishRomanianRussianSalvadoranSamoanScandinavianScotch-IrishScottishSeminoleSenegaleseSerbianShoshoneSierra LeoneanSiouxSlavicSlovakSloveneSomaliSouth AfricanSouth AmericanSouth American IndianSoviet UnionSpaniardSpanishSpanish AmericanSpanish American IndianSri LankanSubsaharan AfricanSudaneseSwedishSwissSyrianTaiwaneseThaiTlingit-HaidaTohono O'OdhamTonganTrinidadian and TobagonianTsimshianTurkishU.S. Virgin IslanderUgandanUkrainianUruguayanUteVenezuelanVietnameseWelshWest IndianYakamaYaquiYugoslavianYumanYup'ikZimbabwean
Immigration
NonimmigrantsImmigrantsAfghanistanAfricaAlbaniaArgentinaArmeniaAsiaAustraliaAustriaBahamasBangladeshBarbadosBelarusBelgiumBelizeBoliviaBosnia and HerzegovinaBrazilBulgariaBurma/MyanmarCabo VerdeCambodiaCameroonCanadaCaribbeanCentral AmericaChileChinaCongoCosta RicaCroatiaCubaCzechoslovakiaDenmarkDominicaDominican RepublicEastern AfricaEastern AsiaEastern EuropeEcuadorEgyptEl SalvadorEnglandEritreaEthiopiaEuropeFijiFranceGermanyGhanaGreeceGrenadaGuatemalaGuyanaHaitiHondurasHong KongHungaryIndiaIndonesiaIranIraqIrelandIsraelItalyJamaicaJapanJordanKazakhstanKenyaKoreaKuwaitLaosLatin AmericaLatviaLebanonLiberiaLithuaniaMalaysiaMexicoMicronesiaMiddle AfricaMoldovaMoroccoNepalNetherlandsNicaraguaNigeriaNorth AmericaNorth MacedoniaNorthern AfricaNorthern EuropeNorwayOceaniaPakistanPanamaPeruPhilippinesPolandPortugalRomaniaRussiaSaudi ArabiaScotlandSenegalSerbiaSierra LeoneSingaporeSomaliaSouth AfricaSouth AmericaSouth Central AsiaSouth Eastern AsiaSouthern EuropeSpainSri LankaSt. Vincent and the GrenadinesSudanSwedenSwitzerlandSyriaTaiwanThailandTrinidad and TobagoTurkeyUgandaUkraineUruguayUzbekistanVenezuelaVietnamWest IndiesWestern AfricaWestern AsiaWestern EuropeYemenZaireZimbabweAzores
Immigrants from Colombia
Race
Ancestry
AfghanAfricanAlaska NativeAlaskan AthabascanAlbanianAleutAlsatianAmericanApacheArabArapahoArgentineanArmenianAssyrian/Chaldean/SyriacAustralianAustrianBahamianBangladeshiBarbadianBasqueBelgianBelizeanBermudanBhutaneseBlackfeetBolivianBrazilianBritishBritish West IndianBulgarianBurmeseCajunCambodianCanadianCape VerdeanCarpatho RusynCelticCentral AmericanCentral American IndianCherokeeCheyenneChickasawChileanChineseChippewaChoctawColombianColvilleComancheCosta RicanCreeCreekCroatianCrowCubanCypriotCzechCzechoslovakianDanishDelawareDominicanDutchDutch West IndianEastern EuropeanEcuadorianEgyptianEnglishEstonianEthiopianEuropeanFijianFilipinoFinnishFrenchFrench American IndianFrench CanadianGermanGerman RussianGhanaianGreekGuamanian/ChamorroGuatemalanGuyaneseHaitianHmongHonduranHopiHoumaHungarianIcelanderIndian (Asian)IndonesianInupiatIranianIraqiIrishIroquoisIsraeliItalianJamaicanJapaneseJordanianKenyanKiowaKoreanLaotianLatvianLebaneseLiberianLithuanianLumbeeLuxembourgerMacedonianMalaysianMalteseMarshalleseMenomineeMexicanMexican American IndianMongolianMoroccanNative HawaiianNavajoNepaleseNew ZealanderNicaraguanNigerianNorthern EuropeanNorwegianOkinawanOsageOttawaPaiutePakistaniPalestinianPanamanianParaguayanPennsylvania GermanPeruvianPimaPolishPortuguesePotawatomiPuebloPuerto RicanPuget Sound SalishRomanianRussianSalvadoranSamoanScandinavianScotch-IrishScottishSeminoleSenegaleseSerbianShoshoneSierra LeoneanSiouxSlavicSlovakSloveneSomaliSouth AfricanSouth AmericanSouth American IndianSoviet UnionSpaniardSpanishSpanish AmericanSpanish American IndianSri LankanSubsaharan AfricanSudaneseSwedishSwissSyrianTaiwaneseThaiTlingit-HaidaTohono O'OdhamTonganTrinidadian and TobagonianTsimshianTurkishU.S. Virgin IslanderUgandanUkrainianUruguayanUteVenezuelanVietnameseWelshWest IndianYakamaYaquiYugoslavianYumanYup'ikZimbabwean
Immigration
NonimmigrantsImmigrantsAfghanistanAfricaAlbaniaArgentinaArmeniaAsiaAustraliaAustriaBahamasBangladeshBarbadosBelarusBelgiumBelizeBoliviaBosnia and HerzegovinaBrazilBulgariaBurma/MyanmarCabo VerdeCambodiaCameroonCanadaCaribbeanCentral AmericaChileChinaColombiaCongoCosta RicaCroatiaCubaCzechoslovakiaDenmarkDominicaDominican RepublicEastern AfricaEastern AsiaEastern EuropeEcuadorEgyptEl SalvadorEnglandEritreaEthiopiaEuropeFijiFranceGermanyGhanaGreeceGrenadaGuatemalaHaitiHondurasHong KongHungaryIndiaIndonesiaIranIraqIrelandIsraelItalyJamaicaJapanJordanKazakhstanKenyaKoreaKuwaitLaosLatin AmericaLatviaLebanonLiberiaLithuaniaMalaysiaMexicoMicronesiaMiddle AfricaMoldovaMoroccoNepalNetherlandsNicaraguaNigeriaNorth AmericaNorth MacedoniaNorthern AfricaNorthern EuropeNorwayOceaniaPakistanPanamaPeruPhilippinesPolandPortugalRomaniaRussiaSaudi ArabiaScotlandSenegalSerbiaSierra LeoneSingaporeSomaliaSouth AfricaSouth AmericaSouth Central AsiaSouth Eastern AsiaSouthern EuropeSpainSri LankaSt. Vincent and the GrenadinesSudanSwedenSwitzerlandSyriaTaiwanThailandTrinidad and TobagoTurkeyUgandaUkraineUruguayUzbekistanVenezuelaVietnamWest IndiesWestern AfricaWestern AsiaWestern EuropeYemenZaireZimbabweAzores
1 or more Vehicles in Household
Income
Poverty
Unemployment
Labor Participation
Family Structure
Vehicle Availability
Education Level
Disability

1 or more Vehicles in Household Comparison

Immigrants from Guyana

Immigrants from Colombia

Tragic
Tragic
70.6%
1 OR MORE VEHICLES IN HOUSEHOLD
0.0/ 100
METRIC RATING
342nd/ 347
METRIC RANK
87.6%
1 OR MORE VEHICLES IN HOUSEHOLD
0.3/ 100
METRIC RATING
267th/ 347
METRIC RANK

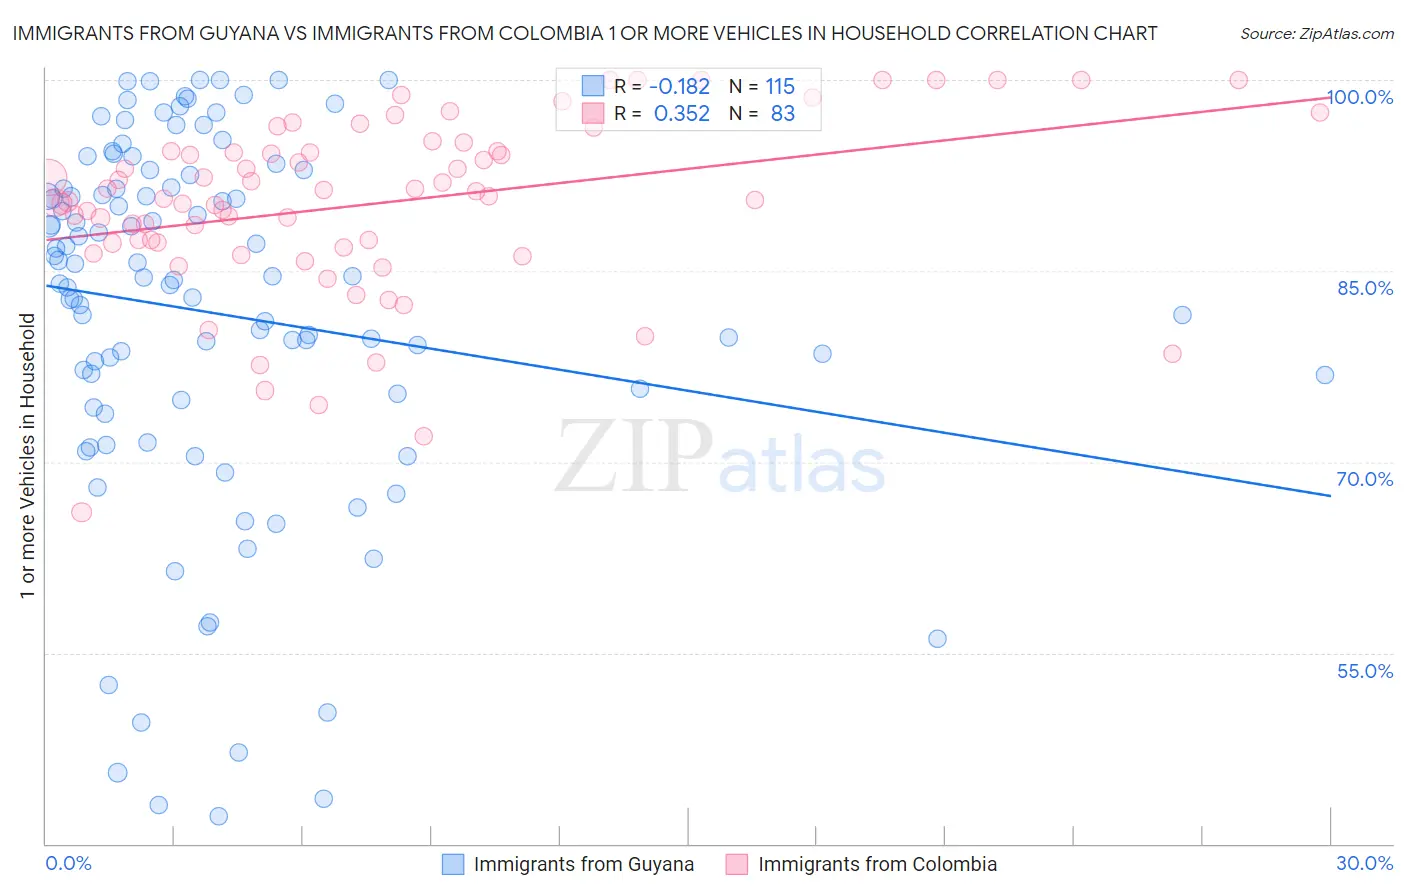
Immigrants from Guyana vs Immigrants from Colombia 1 or more Vehicles in Household Correlation Chart

The statistical analysis conducted on geographies consisting of 183,508,680 people shows a poor negative correlation between the proportion of Immigrants from Guyana and percentage of households with 1 or more vehicles available in the United States with a correlation coefficient (R) of -0.182 and weighted average of 70.6%. Similarly, the statistical analysis conducted on geographies consisting of 378,512,544 people shows a mild positive correlation between the proportion of Immigrants from Colombia and percentage of households with 1 or more vehicles available in the United States with a correlation coefficient (R) of 0.352 and weighted average of 87.6%, a difference of 24.2%.
Immigrants from Guyana vs Immigrants from Colombia 1 or more Vehicles in Household

1 or more Vehicles in Household Correlation Summary

MeasurementImmigrants from GuyanaImmigrants from Colombia
Minimum42.2%66.1%
Maximum100.0%100.0%
Range57.8%33.9%
Mean81.7%90.3%
Median84.4%90.9%
Interquartile 25% (IQ1)74.9%87.2%
Interquartile 75% (IQ3)91.6%94.4%
Interquartile Range (IQR)16.7%7.2%
Standard Deviation (Sample)14.3%6.9%
Standard Deviation (Population)14.3%6.9%

Similar Demographics by 1 or more Vehicles in Household

Demographics Similar to Immigrants from Guyana by 1 or more Vehicles in Household

In terms of 1 or more vehicles in household, the demographic groups most similar to Immigrants from Guyana are Immigrants from Barbados (70.6%, a difference of 0.010%), Dominican (70.7%, a difference of 0.15%), British West Indian (70.4%, a difference of 0.31%), Guyanese (70.8%, a difference of 0.34%), and Inupiat (71.5%, a difference of 1.4%).
DemographicsRating | Rank1 or more Vehicles in Household
Immigrants | Ecuador
0.0
/100
|
#333
Tragic
76.2%
Immigrants | Bangladesh
0.0
/100
|
#334
Tragic
74.3%
Barbadians
0.0
/100
|
#335
Tragic
74.0%
Vietnamese
0.0
/100
|
#336
Tragic
73.8%
Immigrants | Uzbekistan
0.0
/100
|
#337
Tragic
73.4%
Inupiat
0.0
/100
|
#338
Tragic
71.5%
Guyanese
0.0
/100
|
#339
Tragic
70.8%
Dominicans
0.0
/100
|
#340
Tragic
70.7%
Immigrants | Barbados
0.0
/100
|
#341
Tragic
70.6%
Immigrants | Guyana
0.0
/100
|
#342
Tragic
70.6%
British West Indians
0.0
/100
|
#343
Tragic
70.4%
Immigrants | Dominican Republic
0.0
/100
|
#344
Tragic
68.6%
Immigrants | St. Vincent and the Grenadines
0.0
/100
|
#345
Tragic
64.7%
Immigrants | Grenada
0.0
/100
|
#346
Tragic
62.7%
Yup'ik
0.0
/100
|
#347
Tragic
58.4%

Demographics Similar to Immigrants from Colombia by 1 or more Vehicles in Household

In terms of 1 or more vehicles in household, the demographic groups most similar to Immigrants from Colombia are Israeli (87.7%, a difference of 0.030%), Immigrants from Europe (87.6%, a difference of 0.030%), Immigrants from Africa (87.6%, a difference of 0.080%), Panamanian (87.5%, a difference of 0.10%), and Bermudan (87.5%, a difference of 0.10%).
DemographicsRating | Rank1 or more Vehicles in Household
Macedonians
0.6
/100
|
#260
Tragic
87.9%
Immigrants | Switzerland
0.6
/100
|
#261
Tragic
87.9%
Sub-Saharan Africans
0.5
/100
|
#262
Tragic
87.9%
Immigrants | Egypt
0.5
/100
|
#263
Tragic
87.8%
Immigrants | Liberia
0.4
/100
|
#264
Tragic
87.8%
Africans
0.4
/100
|
#265
Tragic
87.8%
Israelis
0.3
/100
|
#266
Tragic
87.7%
Immigrants | Colombia
0.3
/100
|
#267
Tragic
87.6%
Immigrants | Europe
0.2
/100
|
#268
Tragic
87.6%
Immigrants | Africa
0.2
/100
|
#269
Tragic
87.6%
Panamanians
0.2
/100
|
#270
Tragic
87.5%
Bermudans
0.2
/100
|
#271
Tragic
87.5%
Aleuts
0.2
/100
|
#272
Tragic
87.5%
Immigrants | Northern Africa
0.2
/100
|
#273
Tragic
87.4%
Immigrants | Morocco
0.1
/100
|
#274
Tragic
87.4%