Immigrants from Guyana vs Immigrants from Eastern Asia Master's Degree
COMPARE
Immigrants from Guyana
Immigrants from Eastern Asia
Master's Degree
Master's Degree Comparison
Immigrants from Guyana
Immigrants from Eastern Asia
13.4%
MASTER'S DEGREE
4.4/ 100
METRIC RATING
236th/ 347
METRIC RANK
20.8%
MASTER'S DEGREE
100.0/ 100
METRIC RATING
15th/ 347
METRIC RANK
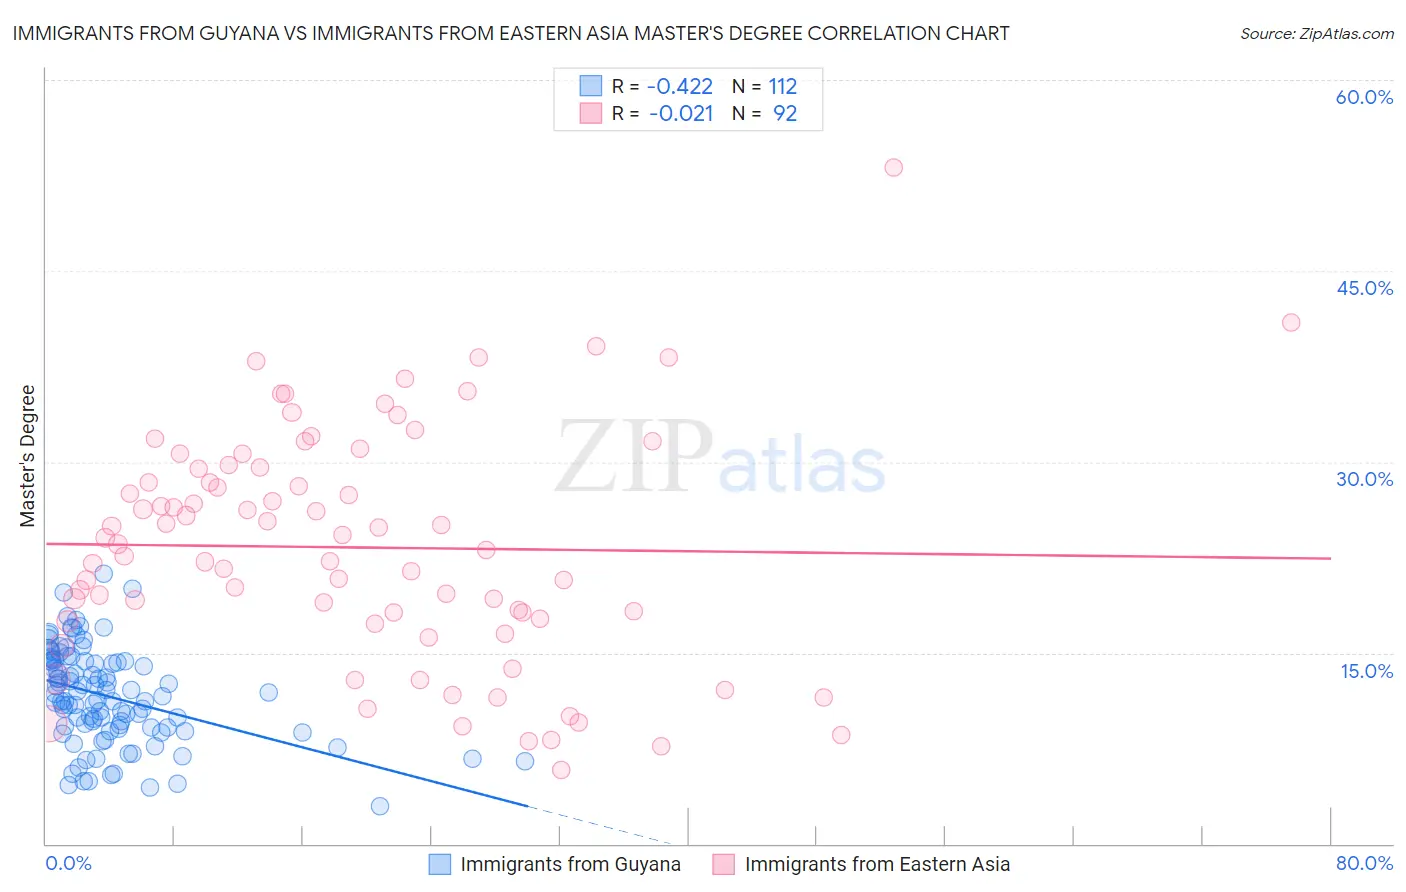
Immigrants from Guyana vs Immigrants from Eastern Asia Master's Degree Correlation Chart
The statistical analysis conducted on geographies consisting of 183,731,921 people shows a moderate negative correlation between the proportion of Immigrants from Guyana and percentage of population with at least master's degree education in the United States with a correlation coefficient (R) of -0.422 and weighted average of 13.4%. Similarly, the statistical analysis conducted on geographies consisting of 499,625,915 people shows no correlation between the proportion of Immigrants from Eastern Asia and percentage of population with at least master's degree education in the United States with a correlation coefficient (R) of -0.021 and weighted average of 20.8%, a difference of 54.9%.
Master's Degree Correlation Summary
| Measurement | Immigrants from Guyana | Immigrants from Eastern Asia |
| Minimum | 3.0% | 5.8% |
| Maximum | 21.2% | 53.1% |
| Range | 18.3% | 47.3% |
| Mean | 11.6% | 23.3% |
| Median | 11.5% | 23.3% |
| Interquartile 25% (IQ1) | 9.1% | 17.6% |
| Interquartile 75% (IQ3) | 14.3% | 29.5% |
| Interquartile Range (IQR) | 5.3% | 11.9% |
| Standard Deviation (Sample) | 3.7% | 9.1% |
| Standard Deviation (Population) | 3.7% | 9.1% |
Similar Demographics by Master's Degree
Demographics Similar to Immigrants from Guyana by Master's Degree
In terms of master's degree, the demographic groups most similar to Immigrants from Guyana are German Russian (13.5%, a difference of 0.11%), Jamaican (13.4%, a difference of 0.22%), Hmong (13.4%, a difference of 0.36%), Immigrants from Burma/Myanmar (13.5%, a difference of 0.52%), and Nonimmigrants (13.3%, a difference of 0.89%).
| Demographics | Rating | Rank | Master's Degree |
| British West Indians | 8.8 /100 | #229 | Tragic 13.8% |
| Dutch | 8.7 /100 | #230 | Tragic 13.8% |
| Guyanese | 7.6 /100 | #231 | Tragic 13.7% |
| Immigrants | Philippines | 6.0 /100 | #232 | Tragic 13.6% |
| Immigrants | Ecuador | 5.7 /100 | #233 | Tragic 13.6% |
| Immigrants | Burma/Myanmar | 5.0 /100 | #234 | Tragic 13.5% |
| German Russians | 4.5 /100 | #235 | Tragic 13.5% |
| Immigrants | Guyana | 4.4 /100 | #236 | Tragic 13.4% |
| Jamaicans | 4.1 /100 | #237 | Tragic 13.4% |
| Hmong | 4.0 /100 | #238 | Tragic 13.4% |
| Immigrants | Nonimmigrants | 3.4 /100 | #239 | Tragic 13.3% |
| Guamanians/Chamorros | 2.2 /100 | #240 | Tragic 13.1% |
| U.S. Virgin Islanders | 2.1 /100 | #241 | Tragic 13.1% |
| Spanish Americans | 1.9 /100 | #242 | Tragic 13.0% |
| Immigrants | Jamaica | 1.9 /100 | #243 | Tragic 13.0% |
Demographics Similar to Immigrants from Eastern Asia by Master's Degree
In terms of master's degree, the demographic groups most similar to Immigrants from Eastern Asia are Immigrants from Switzerland (20.9%, a difference of 0.18%), Immigrants from Australia (20.9%, a difference of 0.19%), Immigrants from Belgium (20.8%, a difference of 0.29%), Immigrants from South Central Asia (20.7%, a difference of 0.54%), and Eastern European (21.1%, a difference of 1.4%).
| Demographics | Rating | Rank | Master's Degree |
| Cypriots | 100.0 /100 | #8 | Exceptional 21.8% |
| Thais | 100.0 /100 | #9 | Exceptional 21.7% |
| Immigrants | Iran | 100.0 /100 | #10 | Exceptional 21.6% |
| Immigrants | China | 100.0 /100 | #11 | Exceptional 21.2% |
| Eastern Europeans | 100.0 /100 | #12 | Exceptional 21.1% |
| Immigrants | Australia | 100.0 /100 | #13 | Exceptional 20.9% |
| Immigrants | Switzerland | 100.0 /100 | #14 | Exceptional 20.9% |
| Immigrants | Eastern Asia | 100.0 /100 | #15 | Exceptional 20.8% |
| Immigrants | Belgium | 100.0 /100 | #16 | Exceptional 20.8% |
| Immigrants | South Central Asia | 100.0 /100 | #17 | Exceptional 20.7% |
| Soviet Union | 100.0 /100 | #18 | Exceptional 20.5% |
| Immigrants | Hong Kong | 100.0 /100 | #19 | Exceptional 20.5% |
| Indians (Asian) | 100.0 /100 | #20 | Exceptional 20.5% |
| Immigrants | Ireland | 100.0 /100 | #21 | Exceptional 20.4% |
| Israelis | 100.0 /100 | #22 | Exceptional 20.3% |