Immigrants from Asia vs Immigrants from Eritrea 1 or more Vehicles in Household
COMPARE
Immigrants from Asia
Immigrants from Eritrea
1 or more Vehicles in Household
1 or more Vehicles in Household Comparison
Immigrants from Asia
Immigrants from Eritrea
89.3%
1 OR MORE VEHICLES IN HOUSEHOLD
22.8/ 100
METRIC RATING
199th/ 347
METRIC RANK
89.4%
1 OR MORE VEHICLES IN HOUSEHOLD
33.2/ 100
METRIC RATING
194th/ 347
METRIC RANK
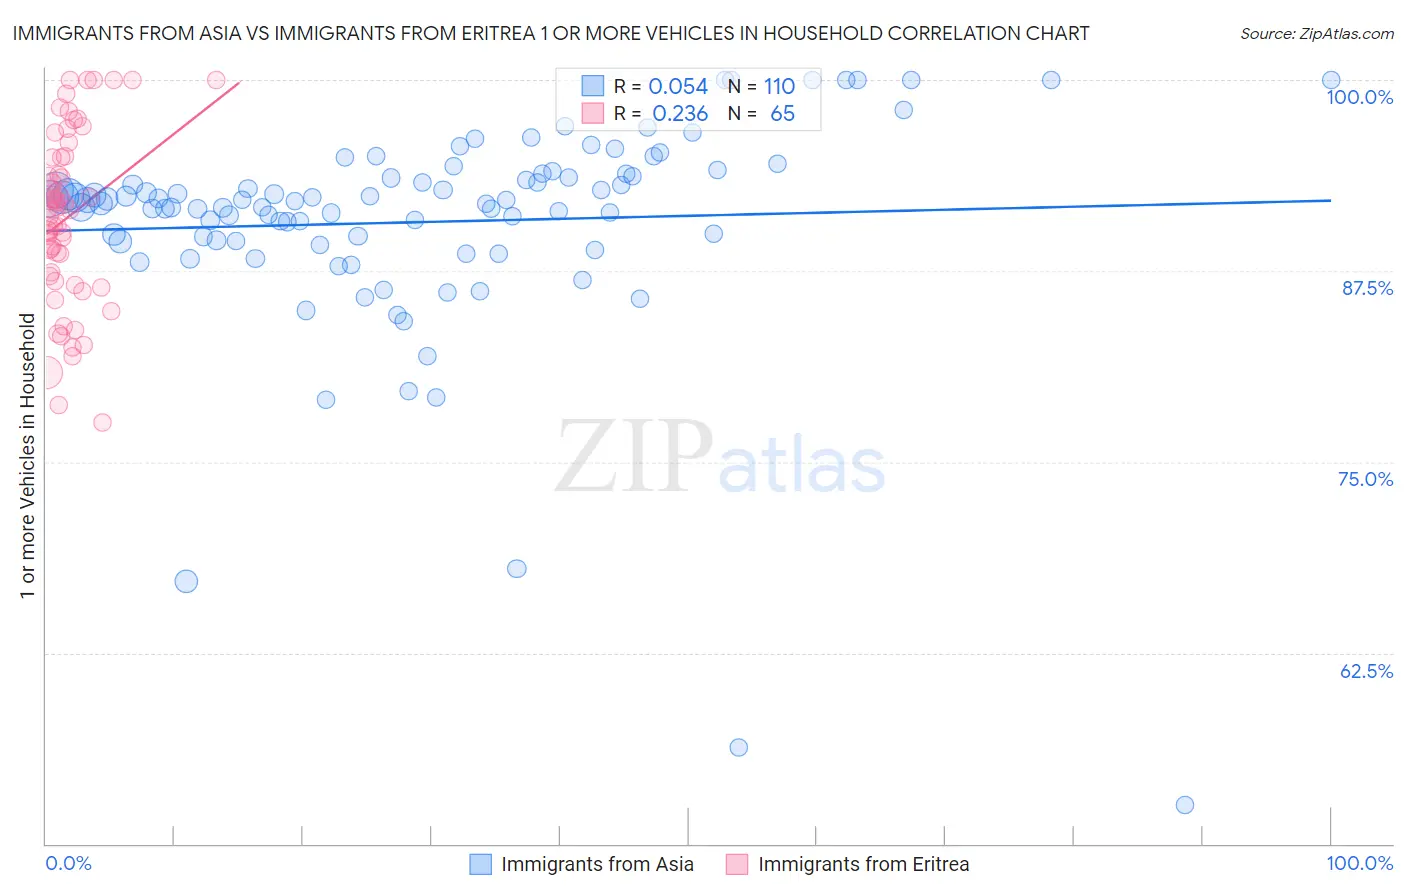
Immigrants from Asia vs Immigrants from Eritrea 1 or more Vehicles in Household Correlation Chart
The statistical analysis conducted on geographies consisting of 548,543,467 people shows a slight positive correlation between the proportion of Immigrants from Asia and percentage of households with 1 or more vehicles available in the United States with a correlation coefficient (R) of 0.054 and weighted average of 89.3%. Similarly, the statistical analysis conducted on geographies consisting of 104,847,164 people shows a weak positive correlation between the proportion of Immigrants from Eritrea and percentage of households with 1 or more vehicles available in the United States with a correlation coefficient (R) of 0.236 and weighted average of 89.4%, a difference of 0.20%.
1 or more Vehicles in Household Correlation Summary
| Measurement | Immigrants from Asia | Immigrants from Eritrea |
| Minimum | 52.6% | 77.6% |
| Maximum | 100.0% | 100.0% |
| Range | 47.4% | 22.4% |
| Mean | 90.7% | 91.0% |
| Median | 92.1% | 91.6% |
| Interquartile 25% (IQ1) | 89.4% | 87.0% |
| Interquartile 75% (IQ3) | 93.7% | 95.0% |
| Interquartile Range (IQR) | 4.3% | 8.0% |
| Standard Deviation (Sample) | 7.3% | 5.6% |
| Standard Deviation (Population) | 7.2% | 5.6% |
Demographics Similar to Immigrants from Asia and Immigrants from Eritrea by 1 or more Vehicles in Household
In terms of 1 or more vehicles in household, the demographic groups most similar to Immigrants from Asia are Pennsylvania German (89.3%, a difference of 0.0%), Immigrants from Sweden (89.3%, a difference of 0.020%), Crow (89.3%, a difference of 0.030%), Central American (89.2%, a difference of 0.030%), and Immigrants from Western Europe (89.2%, a difference of 0.050%). Similarly, the demographic groups most similar to Immigrants from Eritrea are Immigrants from Armenia (89.4%, a difference of 0.020%), Immigrants from Northern Europe (89.5%, a difference of 0.040%), Immigrants from North Macedonia (89.5%, a difference of 0.060%), Shoshone (89.5%, a difference of 0.070%), and Immigrants from Poland (89.5%, a difference of 0.070%).
| Demographics | Rating | Rank | 1 or more Vehicles in Household |
| Pueblo | 39.9 /100 | #186 | Fair 89.6% |
| South Americans | 39.6 /100 | #187 | Fair 89.5% |
| Immigrants | Nepal | 38.9 /100 | #188 | Fair 89.5% |
| Carpatho Rusyns | 37.8 /100 | #189 | Fair 89.5% |
| Shoshone | 37.5 /100 | #190 | Fair 89.5% |
| Immigrants | Poland | 37.1 /100 | #191 | Fair 89.5% |
| Immigrants | North Macedonia | 36.5 /100 | #192 | Fair 89.5% |
| Immigrants | Northern Europe | 35.5 /100 | #193 | Fair 89.5% |
| Immigrants | Eritrea | 33.2 /100 | #194 | Fair 89.4% |
| Immigrants | Armenia | 31.8 /100 | #195 | Fair 89.4% |
| Crow | 24.3 /100 | #196 | Fair 89.3% |
| Immigrants | Sweden | 23.6 /100 | #197 | Fair 89.3% |
| Pennsylvania Germans | 22.9 /100 | #198 | Fair 89.3% |
| Immigrants | Asia | 22.8 /100 | #199 | Fair 89.3% |
| Central Americans | 21.4 /100 | #200 | Fair 89.2% |
| Immigrants | Western Europe | 20.5 /100 | #201 | Fair 89.2% |
| Iroquois | 19.8 /100 | #202 | Poor 89.2% |
| Cambodians | 18.9 /100 | #203 | Poor 89.2% |
| Romanians | 18.2 /100 | #204 | Poor 89.2% |
| Guatemalans | 17.8 /100 | #205 | Poor 89.2% |
| Apache | 16.2 /100 | #206 | Poor 89.1% |