Hungarian vs Immigrants from Honduras 4 or more Vehicles in Household

COMPARE

Hungarian
Race
Ancestry
AfghanAfricanAlaska NativeAlaskan AthabascanAlbanianAleutAlsatianAmericanApacheArabArapahoArgentineanArmenianAssyrian/Chaldean/SyriacAustralianAustrianBahamianBangladeshiBarbadianBasqueBelgianBelizeanBermudanBhutaneseBlackfeetBolivianBrazilianBritishBritish West IndianBulgarianBurmeseCajunCambodianCanadianCape VerdeanCarpatho RusynCelticCentral AmericanCentral American IndianCherokeeCheyenneChickasawChileanChineseChippewaChoctawColombianColvilleComancheCosta RicanCreeCreekCroatianCrowCubanCypriotCzechCzechoslovakianDanishDelawareDominicanDutchDutch West IndianEastern EuropeanEcuadorianEgyptianEnglishEstonianEthiopianEuropeanFijianFilipinoFinnishFrenchFrench American IndianFrench CanadianGermanGerman RussianGhanaianGreekGuamanian/ChamorroGuatemalanGuyaneseHaitianHmongHonduranHopiHoumaHungarianIcelanderIndian (Asian)IndonesianInupiatIranianIraqiIrishIroquoisIsraeliItalianJamaicanJapaneseJordanianKenyanKiowaKoreanLaotianLatvianLebaneseLiberianLithuanianLumbeeLuxembourgerMacedonianMalaysianMalteseMarshalleseMenomineeMexicanMexican American IndianMongolianMoroccanNative HawaiianNavajoNepaleseNew ZealanderNicaraguanNigerianNorthern EuropeanNorwegianOkinawanOsageOttawaPaiutePakistaniPalestinianPanamanianParaguayanPennsylvania GermanPeruvianPimaPolishPortuguesePotawatomiPuebloPuerto RicanPuget Sound SalishRomanianRussianSalvadoranSamoanScandinavianScotch-IrishScottishSeminoleSenegaleseSerbianShoshoneSierra LeoneanSiouxSlavicSlovakSloveneSomaliSouth AfricanSouth AmericanSouth American IndianSoviet UnionSpaniardSpanishSpanish AmericanSpanish American IndianSri LankanSubsaharan AfricanSudaneseSwedishSwissSyrianTaiwaneseThaiTlingit-HaidaTohono O'OdhamTonganTrinidadian and TobagonianTsimshianTurkishU.S. Virgin IslanderUgandanUkrainianUruguayanUteVenezuelanVietnameseWelshWest IndianYakamaYaquiYugoslavianYumanYup'ikZimbabwean
Immigration
NonimmigrantsImmigrantsAfghanistanAfricaAlbaniaArgentinaArmeniaAsiaAustraliaAustriaBahamasBangladeshBarbadosBelarusBelgiumBelizeBoliviaBosnia and HerzegovinaBrazilBulgariaBurma/MyanmarCabo VerdeCambodiaCameroonCanadaCaribbeanCentral AmericaChileChinaColombiaCongoCosta RicaCroatiaCubaCzechoslovakiaDenmarkDominicaDominican RepublicEastern AfricaEastern AsiaEastern EuropeEcuadorEgyptEl SalvadorEnglandEritreaEthiopiaEuropeFijiFranceGermanyGhanaGreeceGrenadaGuatemalaGuyanaHaitiHong KongHungaryIndiaIndonesiaIranIraqIrelandIsraelItalyJamaicaJapanJordanKazakhstanKenyaKoreaKuwaitLaosLatin AmericaLatviaLebanonLiberiaLithuaniaMalaysiaMexicoMicronesiaMiddle AfricaMoldovaMoroccoNepalNetherlandsNicaraguaNigeriaNorth AmericaNorth MacedoniaNorthern AfricaNorthern EuropeNorwayOceaniaPakistanPanamaPeruPhilippinesPolandPortugalRomaniaRussiaSaudi ArabiaScotlandSenegalSerbiaSierra LeoneSingaporeSomaliaSouth AfricaSouth AmericaSouth Central AsiaSouth Eastern AsiaSouthern EuropeSpainSri LankaSt. Vincent and the GrenadinesSudanSwedenSwitzerlandSyriaTaiwanThailandTrinidad and TobagoTurkeyUgandaUkraineUruguayUzbekistanVenezuelaVietnamWest IndiesWestern AfricaWestern AsiaWestern EuropeYemenZaireZimbabweAzores
Immigrants from Honduras
Race
Ancestry
AfghanAfricanAlaska NativeAlaskan AthabascanAlbanianAleutAlsatianAmericanApacheArabArapahoArgentineanArmenianAssyrian/Chaldean/SyriacAustralianAustrianBahamianBangladeshiBarbadianBasqueBelgianBelizeanBermudanBhutaneseBlackfeetBolivianBrazilianBritishBritish West IndianBulgarianBurmeseCajunCambodianCanadianCape VerdeanCarpatho RusynCelticCentral AmericanCentral American IndianCherokeeCheyenneChickasawChileanChineseChippewaChoctawColombianColvilleComancheCosta RicanCreeCreekCroatianCrowCubanCypriotCzechCzechoslovakianDanishDelawareDominicanDutchDutch West IndianEastern EuropeanEcuadorianEgyptianEnglishEstonianEthiopianEuropeanFijianFilipinoFinnishFrenchFrench American IndianFrench CanadianGermanGerman RussianGhanaianGreekGuamanian/ChamorroGuatemalanGuyaneseHaitianHmongHonduranHopiHoumaIcelanderIndian (Asian)IndonesianInupiatIranianIraqiIrishIroquoisIsraeliItalianJamaicanJapaneseJordanianKenyanKiowaKoreanLaotianLatvianLebaneseLiberianLithuanianLumbeeLuxembourgerMacedonianMalaysianMalteseMarshalleseMenomineeMexicanMexican American IndianMongolianMoroccanNative HawaiianNavajoNepaleseNew ZealanderNicaraguanNigerianNorthern EuropeanNorwegianOkinawanOsageOttawaPaiutePakistaniPalestinianPanamanianParaguayanPennsylvania GermanPeruvianPimaPolishPortuguesePotawatomiPuebloPuerto RicanPuget Sound SalishRomanianRussianSalvadoranSamoanScandinavianScotch-IrishScottishSeminoleSenegaleseSerbianShoshoneSierra LeoneanSiouxSlavicSlovakSloveneSomaliSouth AfricanSouth AmericanSouth American IndianSoviet UnionSpaniardSpanishSpanish AmericanSpanish American IndianSri LankanSubsaharan AfricanSudaneseSwedishSwissSyrianTaiwaneseThaiTlingit-HaidaTohono O'OdhamTonganTrinidadian and TobagonianTsimshianTurkishU.S. Virgin IslanderUgandanUkrainianUruguayanUteVenezuelanVietnameseWelshWest IndianYakamaYaquiYugoslavianYumanYup'ikZimbabwean
Immigration
NonimmigrantsImmigrantsAfghanistanAfricaAlbaniaArgentinaArmeniaAsiaAustraliaAustriaBahamasBangladeshBarbadosBelarusBelgiumBelizeBoliviaBosnia and HerzegovinaBrazilBulgariaBurma/MyanmarCabo VerdeCambodiaCameroonCanadaCaribbeanCentral AmericaChileChinaColombiaCongoCosta RicaCroatiaCubaCzechoslovakiaDenmarkDominicaDominican RepublicEastern AfricaEastern AsiaEastern EuropeEcuadorEgyptEl SalvadorEnglandEritreaEthiopiaEuropeFijiFranceGermanyGhanaGreeceGrenadaGuatemalaGuyanaHaitiHondurasHong KongHungaryIndiaIndonesiaIranIraqIrelandIsraelItalyJamaicaJapanJordanKazakhstanKenyaKoreaKuwaitLaosLatin AmericaLatviaLebanonLiberiaLithuaniaMalaysiaMexicoMicronesiaMiddle AfricaMoldovaMoroccoNepalNetherlandsNicaraguaNigeriaNorth AmericaNorth MacedoniaNorthern AfricaNorthern EuropeNorwayOceaniaPakistanPanamaPeruPhilippinesPolandPortugalRomaniaRussiaSaudi ArabiaScotlandSenegalSerbiaSierra LeoneSingaporeSomaliaSouth AfricaSouth AmericaSouth Central AsiaSouth Eastern AsiaSouthern EuropeSpainSri LankaSt. Vincent and the GrenadinesSudanSwedenSwitzerlandSyriaTaiwanThailandTrinidad and TobagoTurkeyUgandaUkraineUruguayUzbekistanVenezuelaVietnamWest IndiesWestern AfricaWestern AsiaWestern EuropeYemenZaireZimbabweAzores
4 or more Vehicles in Household
Income
Poverty
Unemployment
Labor Participation
Family Structure
Vehicle Availability
Education Level
Disability

4 or more Vehicles in Household Comparison

Hungarians

Immigrants from Honduras

Good
Poor
6.4%
4 OR MORE VEHICLES IN HOUSEHOLD
61.1/ 100
METRIC RATING
164th/ 347
METRIC RANK
6.1%
4 OR MORE VEHICLES IN HOUSEHOLD
15.4/ 100
METRIC RATING
209th/ 347
METRIC RANK

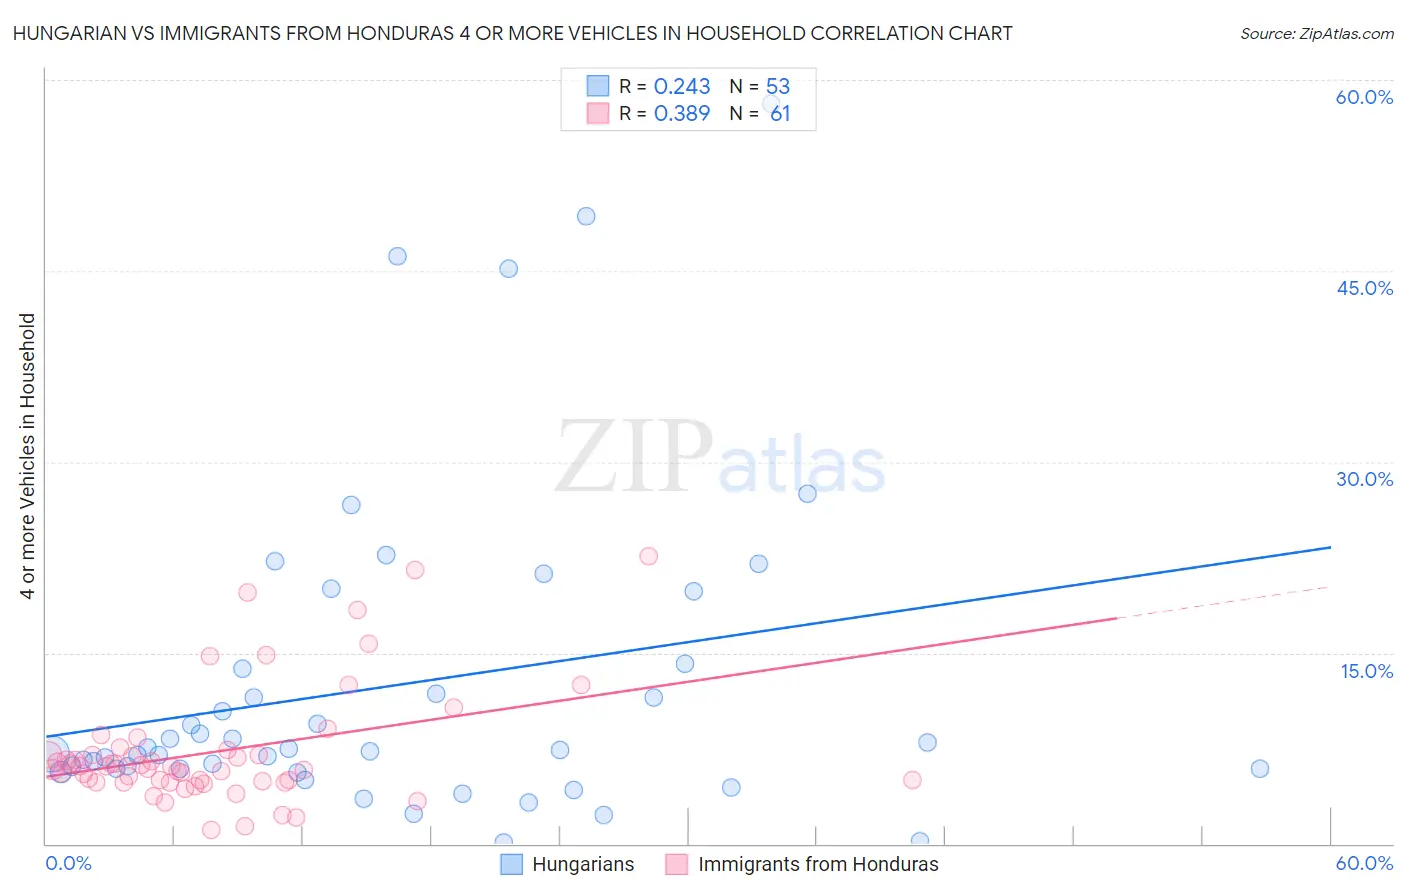
Hungarian vs Immigrants from Honduras 4 or more Vehicles in Household Correlation Chart

The statistical analysis conducted on geographies consisting of 483,846,610 people shows a weak positive correlation between the proportion of Hungarians and percentage of households with 4 or more vehicles available in the United States with a correlation coefficient (R) of 0.243 and weighted average of 6.4%. Similarly, the statistical analysis conducted on geographies consisting of 321,252,543 people shows a mild positive correlation between the proportion of Immigrants from Honduras and percentage of households with 4 or more vehicles available in the United States with a correlation coefficient (R) of 0.389 and weighted average of 6.1%, a difference of 5.7%.
Hungarian vs Immigrants from Honduras 4 or more Vehicles in Household

4 or more Vehicles in Household Correlation Summary

MeasurementHungarianImmigrants from Honduras
Minimum0.062%1.1%
Maximum58.1%22.6%
Range58.1%21.5%
Mean12.4%7.3%
Median7.3%6.1%
Interquartile 25% (IQ1)5.9%4.9%
Interquartile 75% (IQ3)13.9%7.2%
Interquartile Range (IQR)8.0%2.3%
Standard Deviation (Sample)12.6%4.6%
Standard Deviation (Population)12.5%4.6%

Similar Demographics by 4 or more Vehicles in Household

Demographics Similar to Hungarians by 4 or more Vehicles in Household

In terms of 4 or more vehicles in household, the demographic groups most similar to Hungarians are Chilean (6.4%, a difference of 0.010%), Immigrants from Peru (6.4%, a difference of 0.14%), Immigrants from Pakistan (6.4%, a difference of 0.22%), Immigrants from Cameroon (6.4%, a difference of 0.35%), and Immigrants from Denmark (6.4%, a difference of 0.35%).
DemographicsRating | Rank4 or more Vehicles in Household
Peruvians
69.4
/100
|
#157
Good
6.5%
Zimbabweans
67.1
/100
|
#158
Good
6.4%
Indians (Asian)
66.3
/100
|
#159
Good
6.4%
Palestinians
65.8
/100
|
#160
Good
6.4%
Immigrants | Cameroon
64.4
/100
|
#161
Good
6.4%
Immigrants | Pakistan
63.2
/100
|
#162
Good
6.4%
Chileans
61.2
/100
|
#163
Good
6.4%
Hungarians
61.1
/100
|
#164
Good
6.4%
Immigrants | Peru
59.8
/100
|
#165
Average
6.4%
Immigrants | Denmark
57.8
/100
|
#166
Average
6.4%
Poles
56.9
/100
|
#167
Average
6.4%
Lebanese
55.8
/100
|
#168
Average
6.4%
Estonians
55.1
/100
|
#169
Average
6.4%
Immigrants | Syria
52.8
/100
|
#170
Average
6.3%
Immigrants | India
51.9
/100
|
#171
Average
6.3%

Demographics Similar to Immigrants from Honduras by 4 or more Vehicles in Household

In terms of 4 or more vehicles in household, the demographic groups most similar to Immigrants from Honduras are Immigrants from Nigeria (6.1%, a difference of 0.030%), Immigrants from Zimbabwe (6.0%, a difference of 0.050%), Panamanian (6.0%, a difference of 0.13%), Immigrants from Egypt (6.0%, a difference of 0.15%), and Arab (6.0%, a difference of 0.21%).
DemographicsRating | Rank4 or more Vehicles in Household
Immigrants | South Central Asia
21.3
/100
|
#202
Fair
6.1%
Immigrants | Sierra Leone
20.5
/100
|
#203
Fair
6.1%
Immigrants | Belize
19.8
/100
|
#204
Poor
6.1%
Hondurans
19.3
/100
|
#205
Poor
6.1%
Kenyans
18.5
/100
|
#206
Poor
6.1%
Immigrants | Chile
16.9
/100
|
#207
Poor
6.1%
Immigrants | Nigeria
15.6
/100
|
#208
Poor
6.1%
Immigrants | Honduras
15.4
/100
|
#209
Poor
6.1%
Immigrants | Zimbabwe
15.1
/100
|
#210
Poor
6.0%
Panamanians
14.8
/100
|
#211
Poor
6.0%
Immigrants | Egypt
14.7
/100
|
#212
Poor
6.0%
Arabs
14.4
/100
|
#213
Poor
6.0%
Immigrants | Austria
14.3
/100
|
#214
Poor
6.0%
Immigrants | China
13.8
/100
|
#215
Poor
6.0%
Immigrants | Romania
13.8
/100
|
#216
Poor
6.0%