Ghanaian vs Honduran 4 or more Vehicles in Household
COMPARE
Ghanaian
Honduran
4 or more Vehicles in Household
4 or more Vehicles in Household Comparison
Ghanaians
Hondurans
5.2%
4 OR MORE VEHICLES IN HOUSEHOLD
0.1/ 100
METRIC RATING
294th/ 347
METRIC RANK
6.1%
4 OR MORE VEHICLES IN HOUSEHOLD
19.3/ 100
METRIC RATING
205th/ 347
METRIC RANK
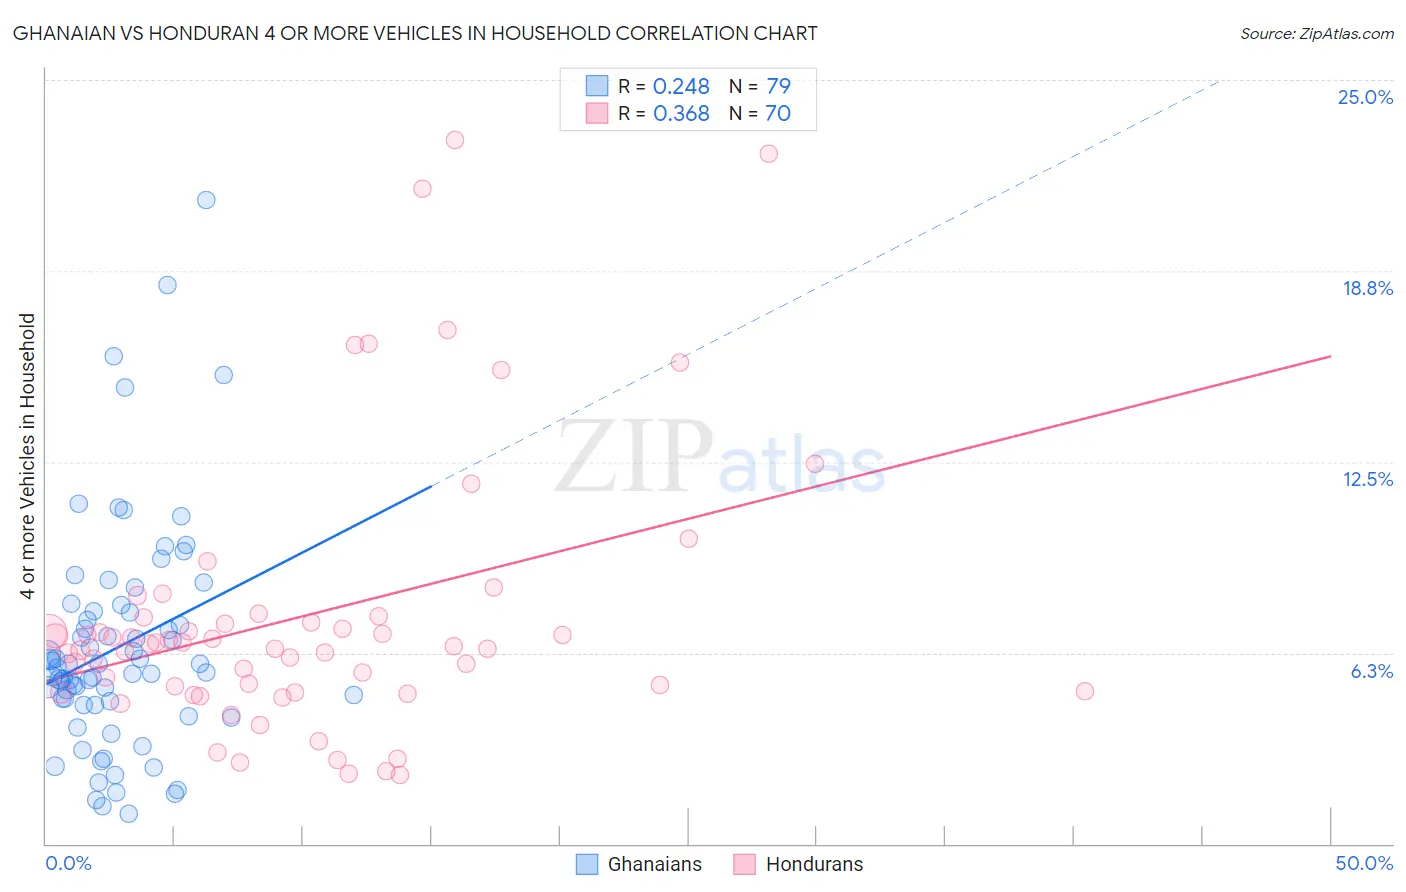
Ghanaian vs Honduran 4 or more Vehicles in Household Correlation Chart
The statistical analysis conducted on geographies consisting of 189,616,639 people shows a weak positive correlation between the proportion of Ghanaians and percentage of households with 4 or more vehicles available in the United States with a correlation coefficient (R) of 0.248 and weighted average of 5.2%. Similarly, the statistical analysis conducted on geographies consisting of 356,171,114 people shows a mild positive correlation between the proportion of Hondurans and percentage of households with 4 or more vehicles available in the United States with a correlation coefficient (R) of 0.368 and weighted average of 6.1%, a difference of 16.2%.
4 or more Vehicles in Household Correlation Summary
| Measurement | Ghanaian | Honduran |
| Minimum | 0.97% | 2.2% |
| Maximum | 21.1% | 23.0% |
| Range | 20.1% | 20.8% |
| Mean | 6.4% | 7.5% |
| Median | 5.8% | 6.5% |
| Interquartile 25% (IQ1) | 4.6% | 5.0% |
| Interquartile 75% (IQ3) | 7.6% | 7.4% |
| Interquartile Range (IQR) | 3.1% | 2.4% |
| Standard Deviation (Sample) | 3.7% | 4.5% |
| Standard Deviation (Population) | 3.7% | 4.5% |
Similar Demographics by 4 or more Vehicles in Household
Demographics Similar to Ghanaians by 4 or more Vehicles in Household
In terms of 4 or more vehicles in household, the demographic groups most similar to Ghanaians are Immigrants from Congo (5.2%, a difference of 0.050%), Liberian (5.3%, a difference of 0.090%), Immigrants from Brazil (5.2%, a difference of 0.11%), Immigrants from Bahamas (5.3%, a difference of 0.19%), and Israeli (5.2%, a difference of 0.29%).
| Demographics | Rating | Rank | 4 or more Vehicles in Household |
| Immigrants | Croatia | 0.2 /100 | #287 | Tragic 5.4% |
| Venezuelans | 0.2 /100 | #288 | Tragic 5.3% |
| Immigrants | Bosnia and Herzegovina | 0.2 /100 | #289 | Tragic 5.3% |
| Immigrants | Russia | 0.2 /100 | #290 | Tragic 5.3% |
| Immigrants | Bahamas | 0.1 /100 | #291 | Tragic 5.3% |
| Liberians | 0.1 /100 | #292 | Tragic 5.3% |
| Immigrants | Congo | 0.1 /100 | #293 | Tragic 5.2% |
| Ghanaians | 0.1 /100 | #294 | Tragic 5.2% |
| Immigrants | Brazil | 0.1 /100 | #295 | Tragic 5.2% |
| Israelis | 0.1 /100 | #296 | Tragic 5.2% |
| Immigrants | Venezuela | 0.1 /100 | #297 | Tragic 5.2% |
| Immigrants | South America | 0.1 /100 | #298 | Tragic 5.2% |
| Immigrants | Ghana | 0.1 /100 | #299 | Tragic 5.2% |
| Immigrants | Morocco | 0.0 /100 | #300 | Tragic 5.1% |
| Immigrants | Zaire | 0.0 /100 | #301 | Tragic 5.1% |
Demographics Similar to Hondurans by 4 or more Vehicles in Household
In terms of 4 or more vehicles in household, the demographic groups most similar to Hondurans are Immigrants from Belize (6.1%, a difference of 0.090%), Kenyan (6.1%, a difference of 0.14%), Immigrants from Sierra Leone (6.1%, a difference of 0.19%), Immigrants from South Central Asia (6.1%, a difference of 0.33%), and Egyptian (6.1%, a difference of 0.34%).
| Demographics | Rating | Rank | 4 or more Vehicles in Household |
| Immigrants | Portugal | 22.3 /100 | #198 | Fair 6.1% |
| Immigrants | Norway | 21.8 /100 | #199 | Fair 6.1% |
| Latvians | 21.7 /100 | #200 | Fair 6.1% |
| Egyptians | 21.4 /100 | #201 | Fair 6.1% |
| Immigrants | South Central Asia | 21.3 /100 | #202 | Fair 6.1% |
| Immigrants | Sierra Leone | 20.5 /100 | #203 | Fair 6.1% |
| Immigrants | Belize | 19.8 /100 | #204 | Poor 6.1% |
| Hondurans | 19.3 /100 | #205 | Poor 6.1% |
| Kenyans | 18.5 /100 | #206 | Poor 6.1% |
| Immigrants | Chile | 16.9 /100 | #207 | Poor 6.1% |
| Immigrants | Nigeria | 15.6 /100 | #208 | Poor 6.1% |
| Immigrants | Honduras | 15.4 /100 | #209 | Poor 6.1% |
| Immigrants | Zimbabwe | 15.1 /100 | #210 | Poor 6.0% |
| Panamanians | 14.8 /100 | #211 | Poor 6.0% |
| Immigrants | Egypt | 14.7 /100 | #212 | Poor 6.0% |