Central American Indian vs Syrian 1 or more Vehicles in Household
COMPARE
Central American Indian
Syrian
1 or more Vehicles in Household
1 or more Vehicles in Household Comparison
Central American Indians
Syrians
86.7%
1 OR MORE VEHICLES IN HOUSEHOLD
0.0/ 100
METRIC RATING
284th/ 347
METRIC RANK
90.3%
1 OR MORE VEHICLES IN HOUSEHOLD
86.3/ 100
METRIC RATING
138th/ 347
METRIC RANK
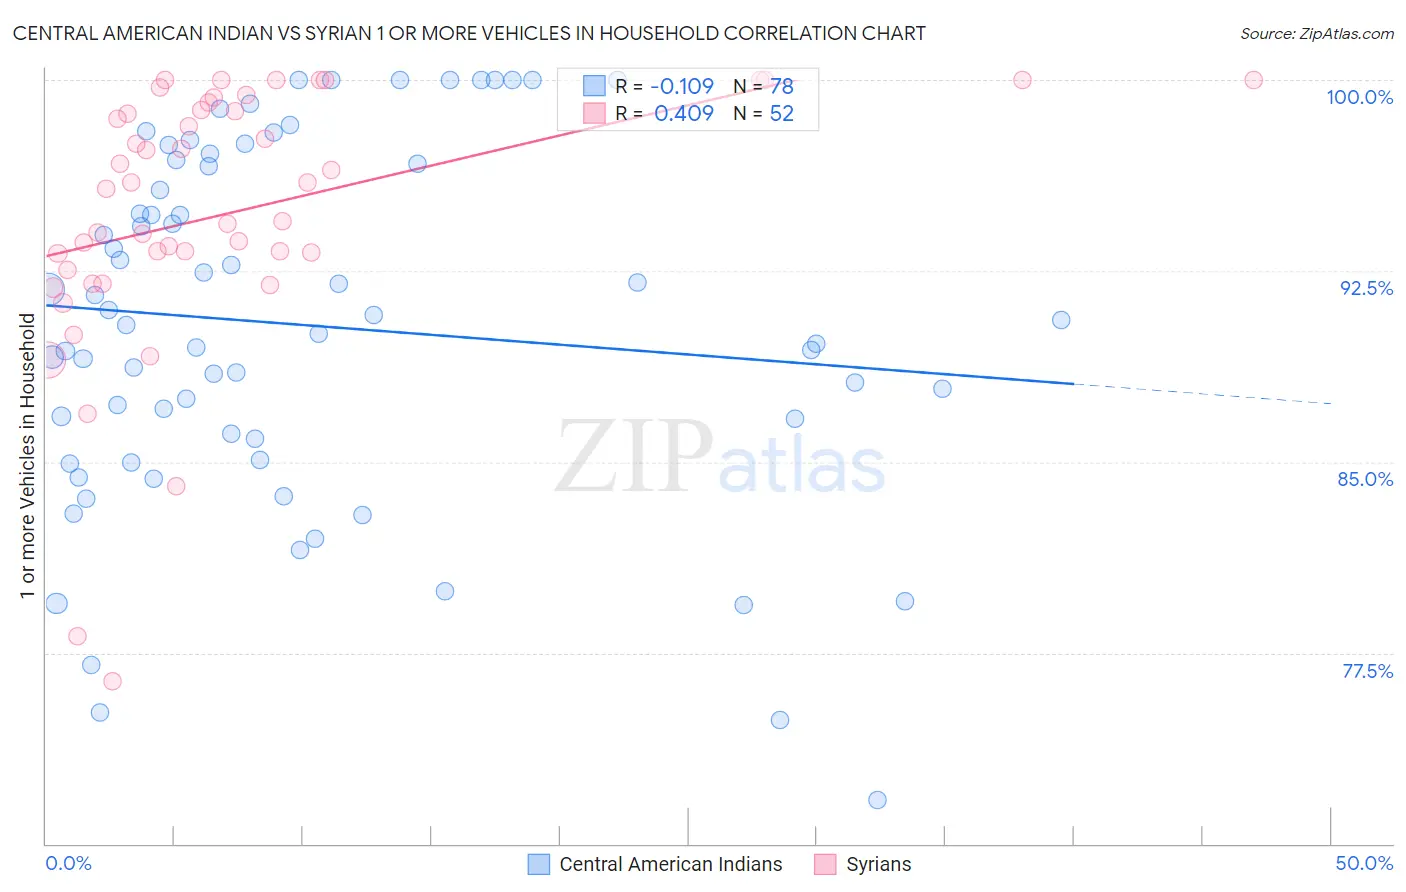
Central American Indian vs Syrian 1 or more Vehicles in Household Correlation Chart
The statistical analysis conducted on geographies consisting of 326,070,398 people shows a poor negative correlation between the proportion of Central American Indians and percentage of households with 1 or more vehicles available in the United States with a correlation coefficient (R) of -0.109 and weighted average of 86.7%. Similarly, the statistical analysis conducted on geographies consisting of 266,214,242 people shows a moderate positive correlation between the proportion of Syrians and percentage of households with 1 or more vehicles available in the United States with a correlation coefficient (R) of 0.409 and weighted average of 90.3%, a difference of 4.1%.
1 or more Vehicles in Household Correlation Summary
| Measurement | Central American Indian | Syrian |
| Minimum | 71.7% | 76.4% |
| Maximum | 100.0% | 100.0% |
| Range | 28.3% | 23.6% |
| Mean | 90.4% | 94.8% |
| Median | 90.5% | 95.8% |
| Interquartile 25% (IQ1) | 85.9% | 92.9% |
| Interquartile 75% (IQ3) | 96.7% | 99.0% |
| Interquartile Range (IQR) | 10.8% | 6.1% |
| Standard Deviation (Sample) | 7.0% | 5.2% |
| Standard Deviation (Population) | 6.9% | 5.2% |
Similar Demographics by 1 or more Vehicles in Household
Demographics Similar to Central American Indians by 1 or more Vehicles in Household
In terms of 1 or more vehicles in household, the demographic groups most similar to Central American Indians are Immigrants from Eastern Europe (86.7%, a difference of 0.0%), Colville (86.8%, a difference of 0.040%), Immigrants from Kazakhstan (86.6%, a difference of 0.20%), Immigrants from Eastern Asia (86.5%, a difference of 0.23%), and Mongolian (87.0%, a difference of 0.27%).
| Demographics | Rating | Rank | 1 or more Vehicles in Household |
| Alsatians | 0.1 /100 | #277 | Tragic 87.1% |
| Immigrants | Southern Europe | 0.1 /100 | #278 | Tragic 87.1% |
| Immigrants | Albania | 0.1 /100 | #279 | Tragic 87.1% |
| Immigrants | Croatia | 0.0 /100 | #280 | Tragic 87.0% |
| Mongolians | 0.0 /100 | #281 | Tragic 87.0% |
| Colville | 0.0 /100 | #282 | Tragic 86.8% |
| Immigrants | Eastern Europe | 0.0 /100 | #283 | Tragic 86.7% |
| Central American Indians | 0.0 /100 | #284 | Tragic 86.7% |
| Immigrants | Kazakhstan | 0.0 /100 | #285 | Tragic 86.6% |
| Immigrants | Eastern Asia | 0.0 /100 | #286 | Tragic 86.5% |
| Immigrants | Malaysia | 0.0 /100 | #287 | Tragic 86.5% |
| Hopi | 0.0 /100 | #288 | Tragic 86.4% |
| Immigrants | Ireland | 0.0 /100 | #289 | Tragic 86.4% |
| Immigrants | Australia | 0.0 /100 | #290 | Tragic 86.4% |
| Pima | 0.0 /100 | #291 | Tragic 86.3% |
Demographics Similar to Syrians by 1 or more Vehicles in Household
In terms of 1 or more vehicles in household, the demographic groups most similar to Syrians are Latvian (90.3%, a difference of 0.0%), Hungarian (90.3%, a difference of 0.010%), Kenyan (90.4%, a difference of 0.020%), Immigrants from Oceania (90.4%, a difference of 0.020%), and Estonian (90.3%, a difference of 0.020%).
| Demographics | Rating | Rank | 1 or more Vehicles in Household |
| Immigrants | Kenya | 88.5 /100 | #131 | Excellent 90.4% |
| Immigrants | South Africa | 88.1 /100 | #132 | Excellent 90.4% |
| Immigrants | Syria | 87.5 /100 | #133 | Excellent 90.4% |
| Kenyans | 87.0 /100 | #134 | Excellent 90.4% |
| Immigrants | Oceania | 86.9 /100 | #135 | Excellent 90.4% |
| Hungarians | 86.5 /100 | #136 | Excellent 90.3% |
| Latvians | 86.3 /100 | #137 | Excellent 90.3% |
| Syrians | 86.3 /100 | #138 | Excellent 90.3% |
| Estonians | 85.6 /100 | #139 | Excellent 90.3% |
| Sudanese | 85.2 /100 | #140 | Excellent 90.3% |
| Immigrants | Moldova | 83.1 /100 | #141 | Excellent 90.2% |
| Immigrants | Lithuania | 83.0 /100 | #142 | Excellent 90.2% |
| Immigrants | Bahamas | 81.5 /100 | #143 | Excellent 90.2% |
| Immigrants | Zimbabwe | 81.5 /100 | #144 | Excellent 90.2% |
| Sioux | 81.3 /100 | #145 | Excellent 90.2% |