Zip Codes with the Highest Percentage of Population Employed in Accommodation & Food Services in Centreville, VA
RELATED REPORTS & OPTIONS
Accommodation & Food Services
Centreville
Compare Zip Codes
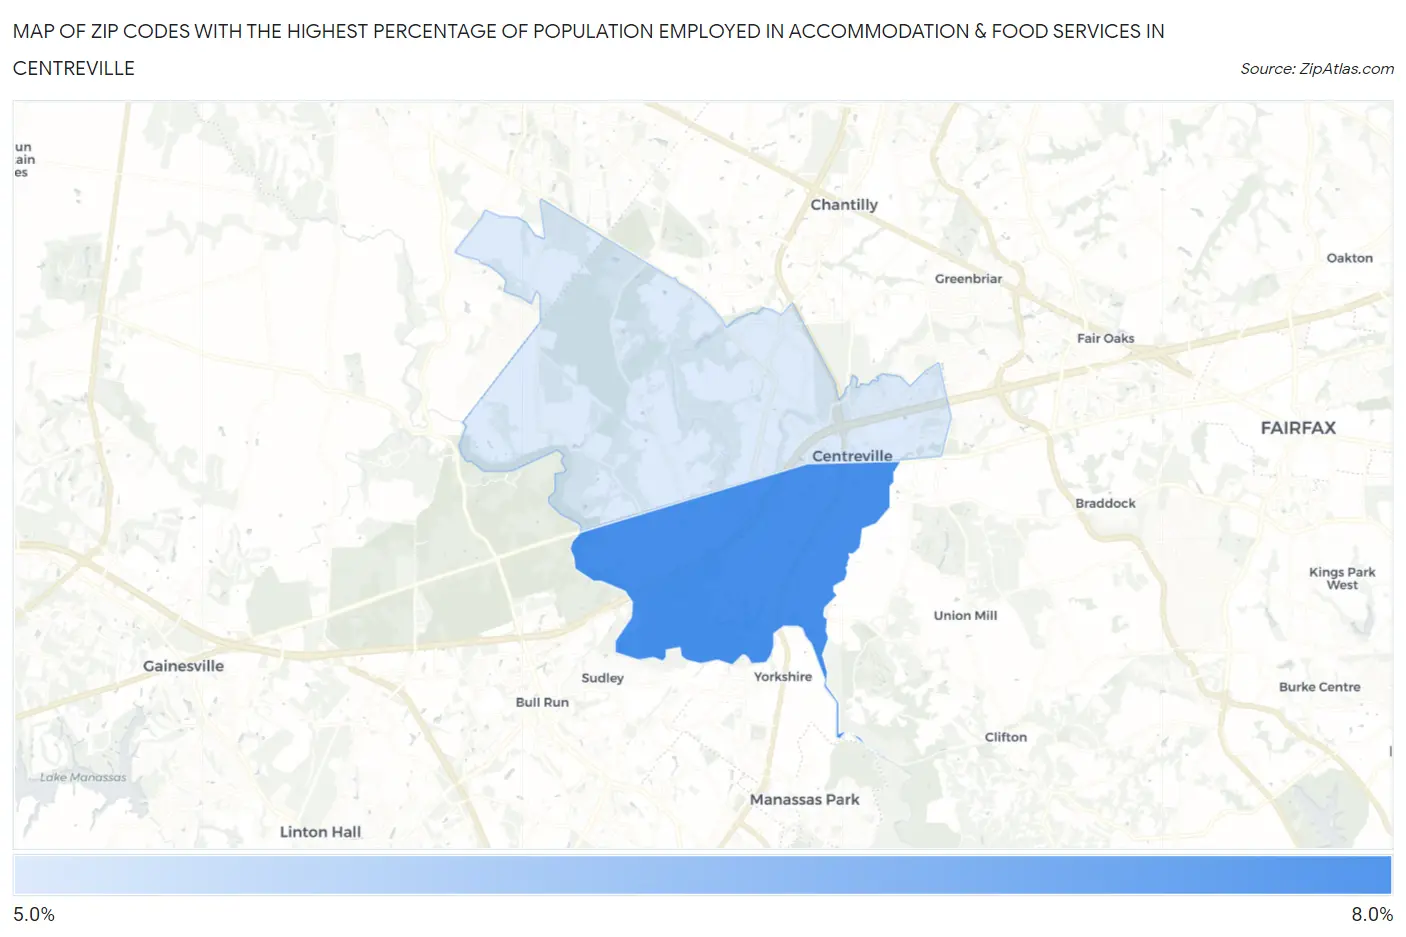
Map of Zip Codes with the Highest Percentage of Population Employed in Accommodation & Food Services in Centreville
5.2%
6.6%
Zip Codes with the Highest Percentage of Population Employed in Accommodation & Food Services in Centreville, VA
| Zip Code | % Employed | vs State | vs National | |
| 1. | 20121 | 6.6% | 6.4%(+0.116)#306 | 6.9%(-0.324)#11,661 |
| 2. | 20120 | 5.2% | 6.4%(-1.27)#429 | 6.9%(-1.71)#16,210 |
1
Common Questions
What are the Top Zip Codes with the Highest Percentage of Population Employed in Accommodation & Food Services in Centreville, VA?
Top Zip Codes with the Highest Percentage of Population Employed in Accommodation & Food Services in Centreville, VA are:
What zip code has the Highest Percentage of Population Employed in Accommodation & Food Services in Centreville, VA?
20121 has the Highest Percentage of Population Employed in Accommodation & Food Services in Centreville, VA with 6.6%.
What is the Percentage of Population Employed in Accommodation & Food Services in Centreville, VA?
Percentage of Population Employed in Accommodation & Food Services in Centreville is 5.5%.
What is the Percentage of Population Employed in Accommodation & Food Services in Virginia?
Percentage of Population Employed in Accommodation & Food Services in Virginia is 6.4%.
What is the Percentage of Population Employed in Accommodation & Food Services in the United States?
Percentage of Population Employed in Accommodation & Food Services in the United States is 6.9%.