Zip Codes with the Highest Percentage of Population Employed in Accommodation & Food Services in Hampton, VA
RELATED REPORTS & OPTIONS
Accommodation & Food Services
Hampton
Compare Zip Codes
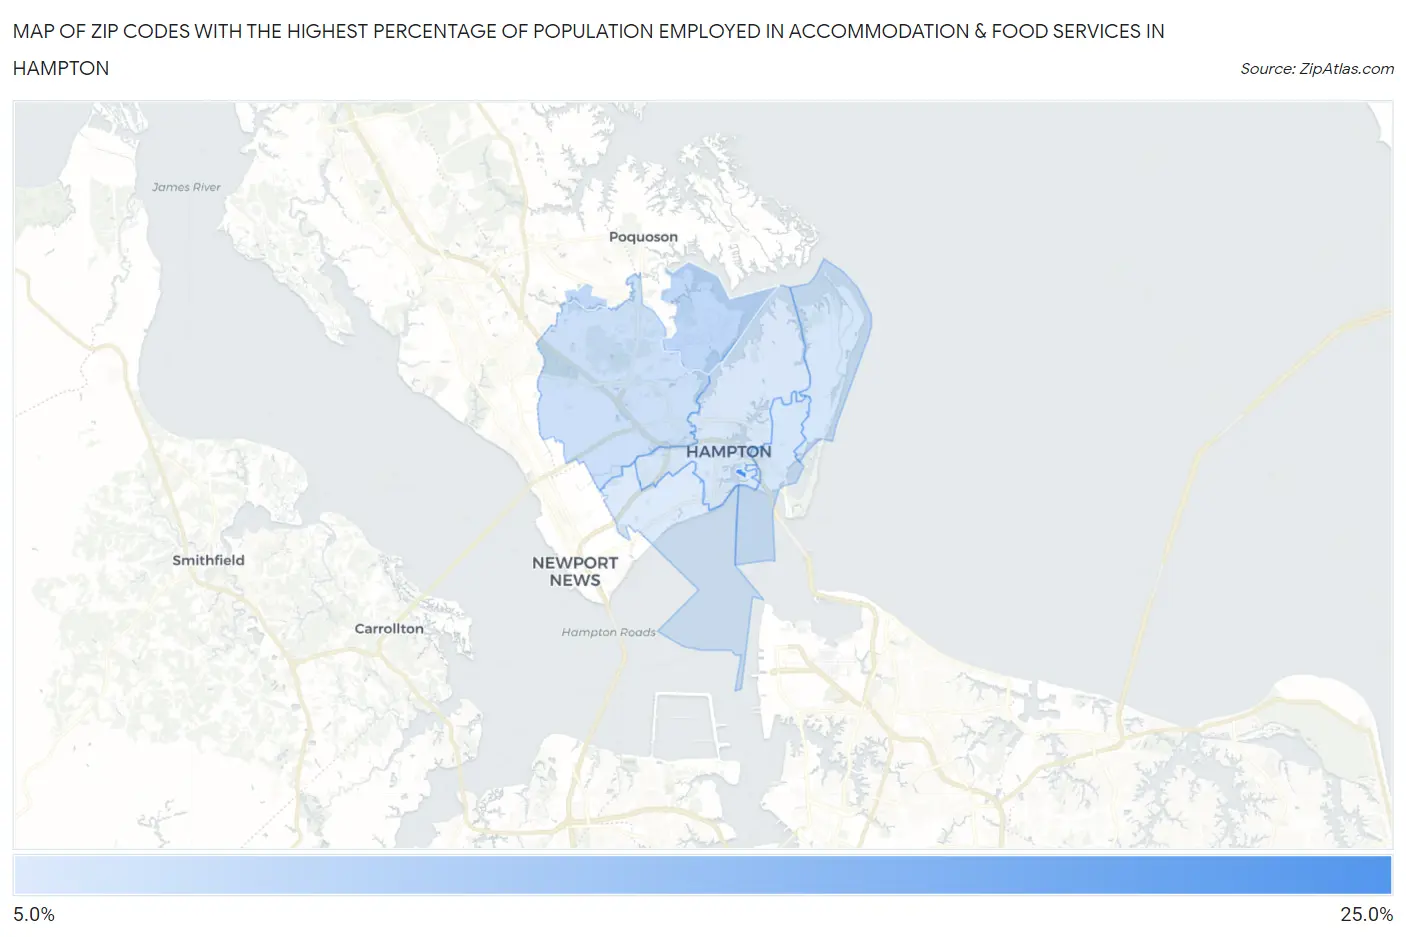
Map of Zip Codes with the Highest Percentage of Population Employed in Accommodation & Food Services in Hampton
6.0%
22.7%
Zip Codes with the Highest Percentage of Population Employed in Accommodation & Food Services in Hampton, VA
| Zip Code | % Employed | vs State | vs National | |
| 1. | 23668 | 22.7% | 6.4%(+16.2)#18 | 6.9%(+15.8)#641 |
| 2. | 23665 | 9.0% | 6.4%(+2.60)#149 | 6.9%(+2.16)#5,896 |
| 3. | 23666 | 7.8% | 6.4%(+1.34)#212 | 6.9%(+0.899)#8,315 |
| 4. | 23663 | 6.8% | 6.4%(+0.395)#279 | 6.9%(-0.045)#10,768 |
| 5. | 23664 | 6.8% | 6.4%(+0.370)#282 | 6.9%(-0.070)#10,850 |
| 6. | 23669 | 6.4% | 6.4%(-0.033)#316 | 6.9%(-0.473)#12,131 |
| 7. | 23661 | 6.0% | 6.4%(-0.418)#352 | 6.9%(-0.858)#13,377 |
1
Common Questions
What are the Top 5 Zip Codes with the Highest Percentage of Population Employed in Accommodation & Food Services in Hampton, VA?
Top 5 Zip Codes with the Highest Percentage of Population Employed in Accommodation & Food Services in Hampton, VA are:
What zip code has the Highest Percentage of Population Employed in Accommodation & Food Services in Hampton, VA?
23668 has the Highest Percentage of Population Employed in Accommodation & Food Services in Hampton, VA with 22.7%.
What is the Percentage of Population Employed in Accommodation & Food Services in Hampton, VA?
Percentage of Population Employed in Accommodation & Food Services in Hampton is 7.1%.
What is the Percentage of Population Employed in Accommodation & Food Services in Virginia?
Percentage of Population Employed in Accommodation & Food Services in Virginia is 6.4%.
What is the Percentage of Population Employed in Accommodation & Food Services in the United States?
Percentage of Population Employed in Accommodation & Food Services in the United States is 6.9%.