Zip Codes with the Highest Percentage of Population Employed in Accommodation & Food Services in Charlottesville, VA
RELATED REPORTS & OPTIONS
Accommodation & Food Services
Charlottesville
Compare Zip Codes
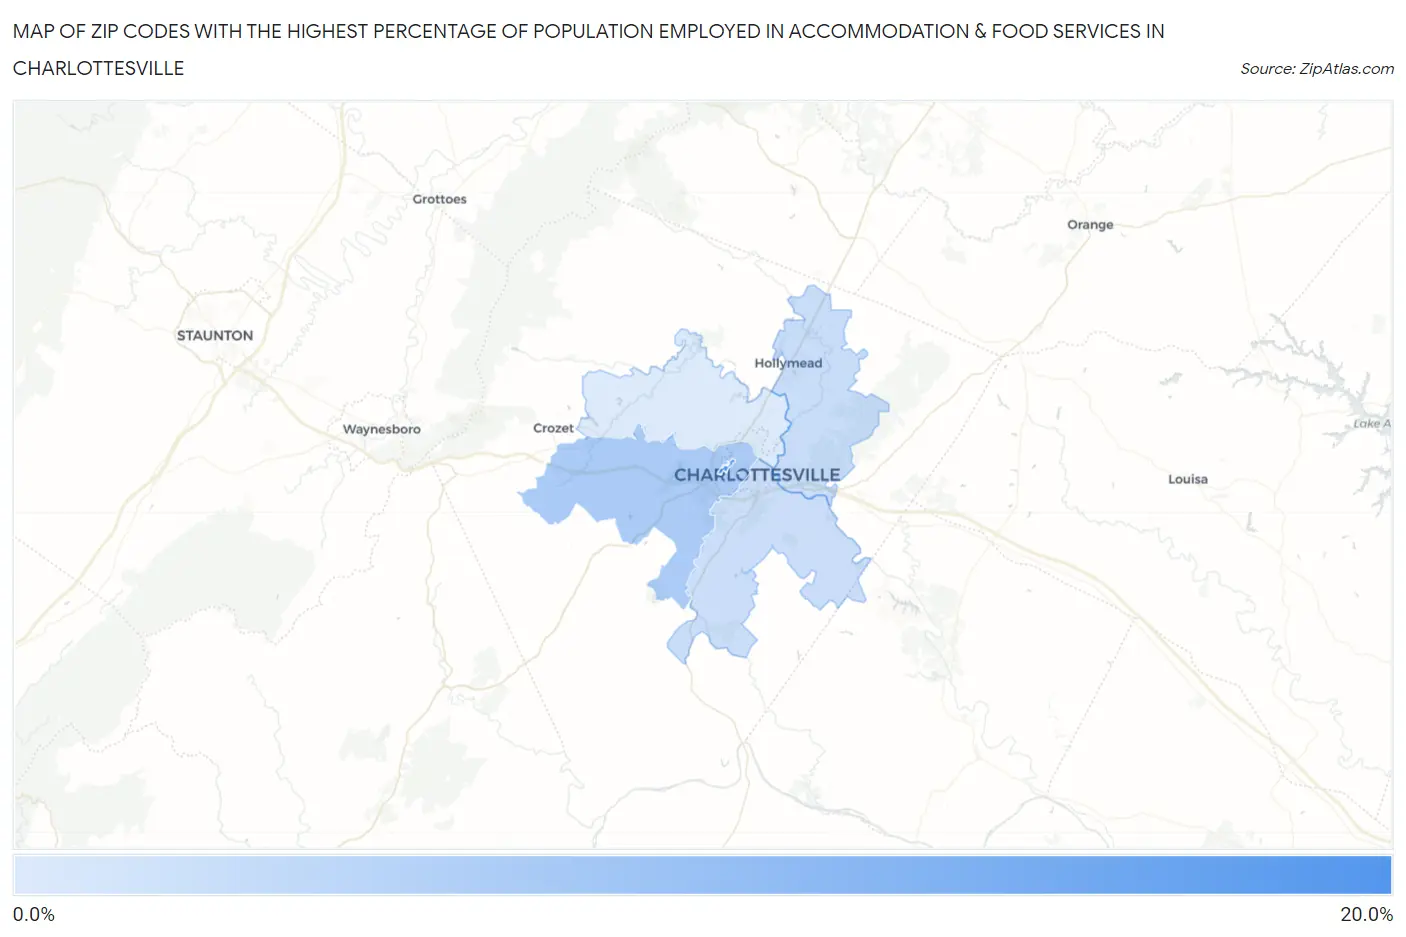
Map of Zip Codes with the Highest Percentage of Population Employed in Accommodation & Food Services in Charlottesville
5.8%
15.7%
Zip Codes with the Highest Percentage of Population Employed in Accommodation & Food Services in Charlottesville, VA
| Zip Code | % Employed | vs State | vs National | |
| 1. | 22904 | 15.7% | 6.4%(+9.30)#48 | 6.9%(+8.86)#1,507 |
| 2. | 22903 | 9.0% | 6.4%(+2.56)#151 | 6.9%(+2.12)#5,950 |
| 3. | 22911 | 7.1% | 6.4%(+0.636)#257 | 6.9%(+0.196)#10,111 |
| 4. | 22902 | 7.0% | 6.4%(+0.571)#260 | 6.9%(+0.131)#10,263 |
| 5. | 22901 | 5.8% | 6.4%(-0.642)#374 | 6.9%(-1.08)#14,083 |
1
Common Questions
What are the Top 3 Zip Codes with the Highest Percentage of Population Employed in Accommodation & Food Services in Charlottesville, VA?
Top 3 Zip Codes with the Highest Percentage of Population Employed in Accommodation & Food Services in Charlottesville, VA are:
What zip code has the Highest Percentage of Population Employed in Accommodation & Food Services in Charlottesville, VA?
22904 has the Highest Percentage of Population Employed in Accommodation & Food Services in Charlottesville, VA with 15.7%.
What is the Percentage of Population Employed in Accommodation & Food Services in Charlottesville, VA?
Percentage of Population Employed in Accommodation & Food Services in Charlottesville is 9.5%.
What is the Percentage of Population Employed in Accommodation & Food Services in Virginia?
Percentage of Population Employed in Accommodation & Food Services in Virginia is 6.4%.
What is the Percentage of Population Employed in Accommodation & Food Services in the United States?
Percentage of Population Employed in Accommodation & Food Services in the United States is 6.9%.