Zip Codes with the Highest Percentage of Population Employed in Accommodation & Food Services in Chesapeake, VA
RELATED REPORTS & OPTIONS
Accommodation & Food Services
Chesapeake
Compare Zip Codes
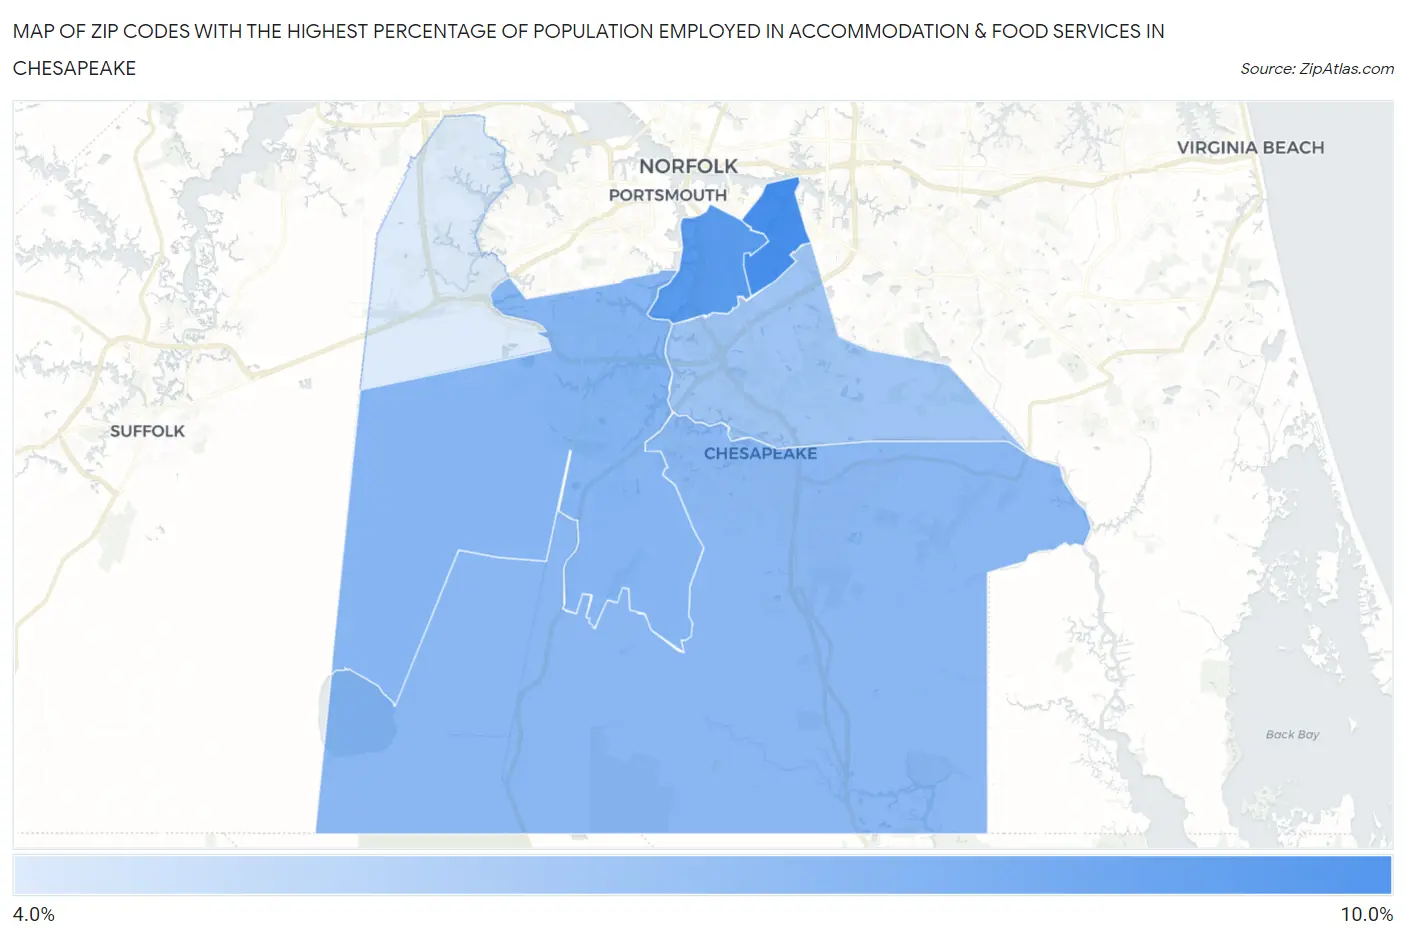
Map of Zip Codes with the Highest Percentage of Population Employed in Accommodation & Food Services in Chesapeake
4.2%
9.8%
Zip Codes with the Highest Percentage of Population Employed in Accommodation & Food Services in Chesapeake, VA
| Zip Code | % Employed | vs State | vs National | |
| 1. | 23325 | 9.8% | 6.4%(+3.33)#122 | 6.9%(+2.89)#4,830 |
| 2. | 23324 | 9.2% | 6.4%(+2.73)#144 | 6.9%(+2.29)#5,691 |
| 3. | 23323 | 7.4% | 6.4%(+0.991)#229 | 6.9%(+0.551)#9,164 |
| 4. | 23322 | 7.3% | 6.4%(+0.822)#242 | 6.9%(+0.382)#9,639 |
| 5. | 23320 | 6.4% | 6.4%(-0.008)#315 | 6.9%(-0.448)#12,052 |
| 6. | 23321 | 4.2% | 6.4%(-2.26)#498 | 6.9%(-2.70)#19,573 |
1
Common Questions
What are the Top 5 Zip Codes with the Highest Percentage of Population Employed in Accommodation & Food Services in Chesapeake, VA?
Top 5 Zip Codes with the Highest Percentage of Population Employed in Accommodation & Food Services in Chesapeake, VA are:
What zip code has the Highest Percentage of Population Employed in Accommodation & Food Services in Chesapeake, VA?
23325 has the Highest Percentage of Population Employed in Accommodation & Food Services in Chesapeake, VA with 9.8%.
What is the Percentage of Population Employed in Accommodation & Food Services in Chesapeake, VA?
Percentage of Population Employed in Accommodation & Food Services in Chesapeake is 6.9%.
What is the Percentage of Population Employed in Accommodation & Food Services in Virginia?
Percentage of Population Employed in Accommodation & Food Services in Virginia is 6.4%.
What is the Percentage of Population Employed in Accommodation & Food Services in the United States?
Percentage of Population Employed in Accommodation & Food Services in the United States is 6.9%.