Zip Codes with the Highest Percentage of Population Employed in Accommodation & Food Services in Falls Church, VA
RELATED REPORTS & OPTIONS
Accommodation & Food Services
Falls Church
Compare Zip Codes
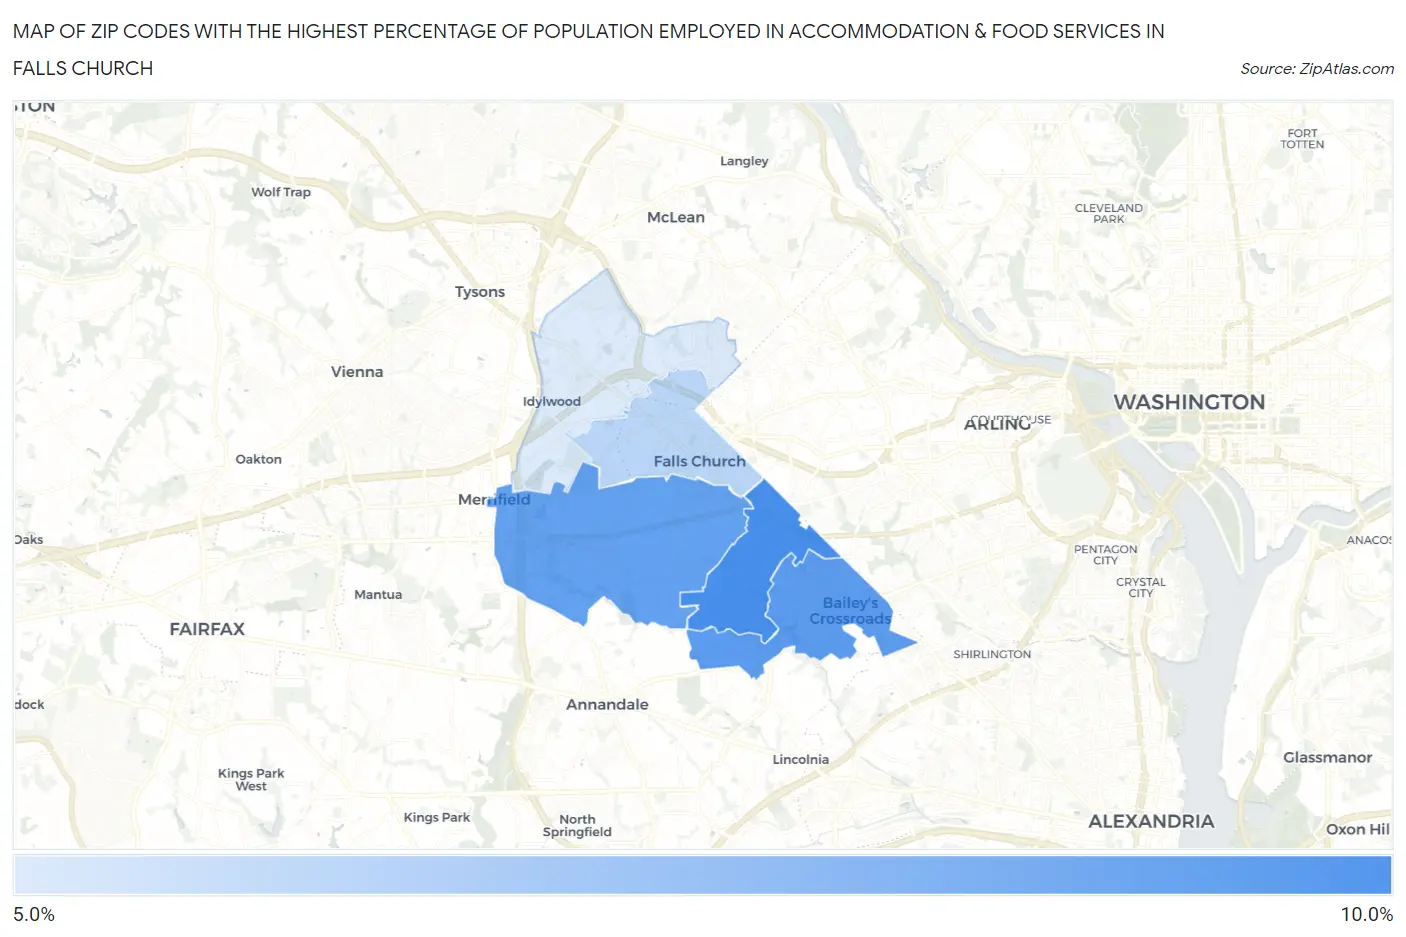
Map of Zip Codes with the Highest Percentage of Population Employed in Accommodation & Food Services in Falls Church
5.6%
9.0%
Zip Codes with the Highest Percentage of Population Employed in Accommodation & Food Services in Falls Church, VA
| Zip Code | % Employed | vs State | vs National | |
| 1. | 22044 | 9.0% | 6.4%(+2.51)#154 | 6.9%(+2.07)#6,039 |
| 2. | 22041 | 8.5% | 6.4%(+2.02)#172 | 6.9%(+1.58)#6,880 |
| 3. | 22042 | 8.3% | 6.4%(+1.87)#182 | 6.9%(+1.43)#7,200 |
| 4. | 22046 | 6.4% | 6.4%(-0.057)#323 | 6.9%(-0.497)#12,207 |
| 5. | 22043 | 5.6% | 6.4%(-0.843)#393 | 6.9%(-1.28)#14,705 |
1
Common Questions
What are the Top 3 Zip Codes with the Highest Percentage of Population Employed in Accommodation & Food Services in Falls Church, VA?
Top 3 Zip Codes with the Highest Percentage of Population Employed in Accommodation & Food Services in Falls Church, VA are:
What zip code has the Highest Percentage of Population Employed in Accommodation & Food Services in Falls Church, VA?
22044 has the Highest Percentage of Population Employed in Accommodation & Food Services in Falls Church, VA with 9.0%.
What is the Percentage of Population Employed in Accommodation & Food Services in Falls Church, VA?
Percentage of Population Employed in Accommodation & Food Services in Falls Church is 5.8%.
What is the Percentage of Population Employed in Accommodation & Food Services in Virginia?
Percentage of Population Employed in Accommodation & Food Services in Virginia is 6.4%.
What is the Percentage of Population Employed in Accommodation & Food Services in the United States?
Percentage of Population Employed in Accommodation & Food Services in the United States is 6.9%.