Zip Codes with the Highest Percentage of Population Employed in Accommodation & Food Services in Williamsburg, VA
RELATED REPORTS & OPTIONS
Accommodation & Food Services
Williamsburg
Compare Zip Codes
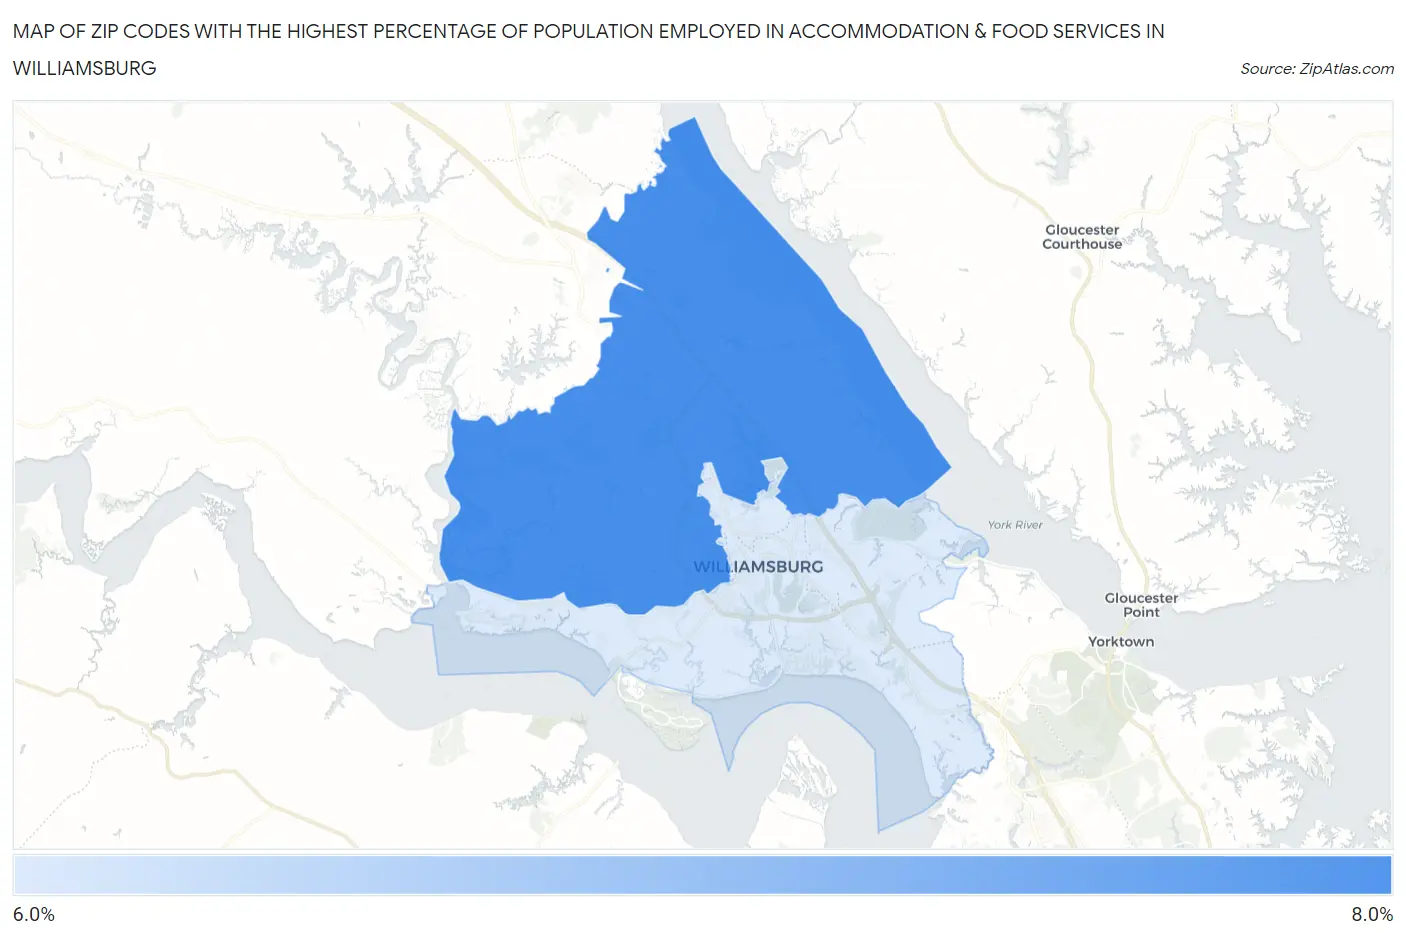
Map of Zip Codes with the Highest Percentage of Population Employed in Accommodation & Food Services in Williamsburg
6.9%
8.0%
Zip Codes with the Highest Percentage of Population Employed in Accommodation & Food Services in Williamsburg, VA
| Zip Code | % Employed | vs State | vs National | |
| 1. | 23188 | 8.0% | 6.4%(+1.55)#198 | 6.9%(+1.11)#7,831 |
| 2. | 23185 | 6.9% | 6.4%(+0.446)#275 | 6.9%(+0.006)#10,623 |
1
Common Questions
What are the Top Zip Codes with the Highest Percentage of Population Employed in Accommodation & Food Services in Williamsburg, VA?
Top Zip Codes with the Highest Percentage of Population Employed in Accommodation & Food Services in Williamsburg, VA are:
What zip code has the Highest Percentage of Population Employed in Accommodation & Food Services in Williamsburg, VA?
23188 has the Highest Percentage of Population Employed in Accommodation & Food Services in Williamsburg, VA with 8.0%.
What is the Percentage of Population Employed in Accommodation & Food Services in Williamsburg, VA?
Percentage of Population Employed in Accommodation & Food Services in Williamsburg is 10.3%.
What is the Percentage of Population Employed in Accommodation & Food Services in Virginia?
Percentage of Population Employed in Accommodation & Food Services in Virginia is 6.4%.
What is the Percentage of Population Employed in Accommodation & Food Services in the United States?
Percentage of Population Employed in Accommodation & Food Services in the United States is 6.9%.