Zip Codes with the Highest Percentage of Population Employed in Architecture & Engineering in Hampton, VA
RELATED REPORTS & OPTIONS
Architecture & Engineering
Hampton
Compare Zip Codes
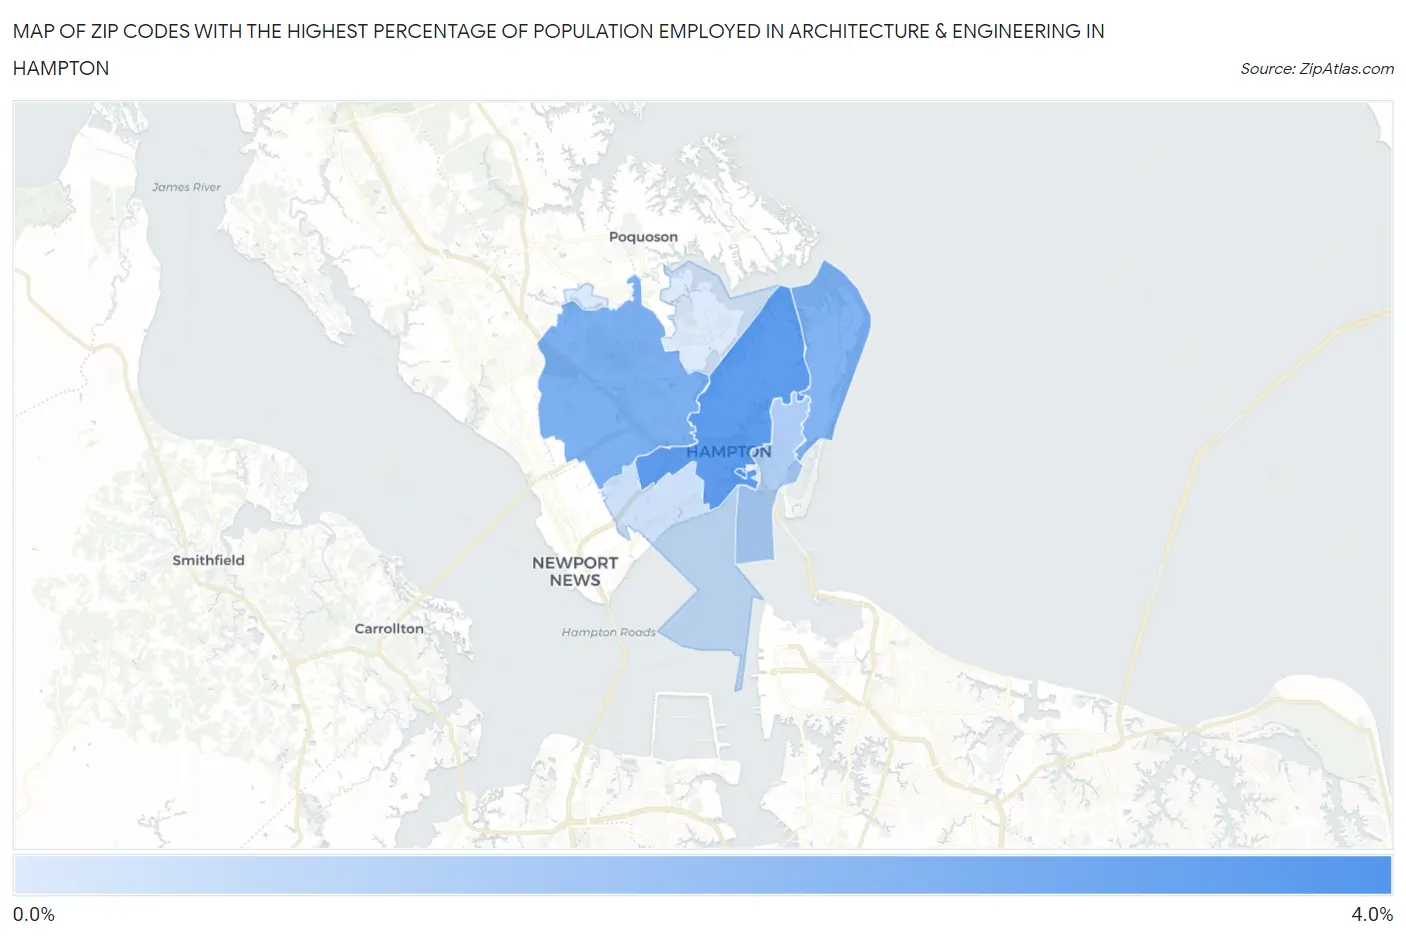
Map of Zip Codes with the Highest Percentage of Population Employed in Architecture & Engineering in Hampton
0.81%
3.3%
Zip Codes with the Highest Percentage of Population Employed in Architecture & Engineering in Hampton, VA
| Zip Code | % Employed | vs State | vs National | |
| 1. | 23668 | 3.3% | 2.3%(+1.03)#130 | 2.1%(+1.18)#4,105 |
| 2. | 23669 | 3.0% | 2.3%(+0.650)#159 | 2.1%(+0.806)#5,218 |
| 3. | 23666 | 2.4% | 2.3%(+0.113)#221 | 2.1%(+0.269)#7,391 |
| 4. | 23664 | 2.4% | 2.3%(+0.058)#226 | 2.1%(+0.214)#7,657 |
| 5. | 23663 | 1.6% | 2.3%(-0.724)#345 | 2.1%(-0.568)#12,295 |
| 6. | 23661 | 1.1% | 2.3%(-1.23)#429 | 2.1%(-1.07)#16,052 |
| 7. | 23665 | 0.81% | 2.3%(-1.49)#483 | 2.1%(-1.34)#18,022 |
1
Common Questions
What are the Top 5 Zip Codes with the Highest Percentage of Population Employed in Architecture & Engineering in Hampton, VA?
Top 5 Zip Codes with the Highest Percentage of Population Employed in Architecture & Engineering in Hampton, VA are:
What zip code has the Highest Percentage of Population Employed in Architecture & Engineering in Hampton, VA?
23668 has the Highest Percentage of Population Employed in Architecture & Engineering in Hampton, VA with 3.3%.
What is the Percentage of Population Employed in Architecture & Engineering in Hampton, VA?
Percentage of Population Employed in Architecture & Engineering in Hampton is 2.3%.
What is the Percentage of Population Employed in Architecture & Engineering in Virginia?
Percentage of Population Employed in Architecture & Engineering in Virginia is 2.3%.
What is the Percentage of Population Employed in Architecture & Engineering in the United States?
Percentage of Population Employed in Architecture & Engineering in the United States is 2.1%.