Zip Codes with the Highest Percentage of Population with a Degree in Literature and Languages in Hampton, VA

RELATED REPORTS & OPTIONS

Literature and Languages
Population
Families and Households
Female Fertility
Female Fertility (Unmarried)
Race (Community Size)
Race (Percentage)
Ancestry (Community Size)
AfricanAmericanApacheArabArgentineanBarbadianBelgianBelizeanBhutaneseBlackfeetBritishBritish West IndianBurmeseCanadianCentral AmericanCentral American IndianCherokeeChileanColombianCroatianCubanCzechCzechoslovakianDanishDominicanDutchEastern EuropeanEcuadorianEgyptianEnglishEthiopianEuropeanFinnishFrenchFrench CanadianGermanGhanaianGreekGuamanian / ChamorroGuatemalanGuyaneseHaitianHonduranHungarianIndian (Asian)IranianIraqiIrishIroquoisIsraeliItalianJamaicanJapaneseKoreanLaotianLebaneseLithuanianMexicanMexican American IndianMoroccanNative HawaiianNigerianNorthern EuropeanNorwegianPakistaniPanamanianPennsylvania GermanPolishPortuguesePuerto RicanRomanianRussianSalvadoranSamoanScandinavianScotch-IrishScottishSlavicSlovakSouth AmericanSpaniardSpanishSri LankanSubsaharan AfricanSwedishSwissSyrianThaiTrinidadian and TobagonianUkrainianWelshWest IndianYugoslavian
Ancestry (Percentage)
AfricanAmericanApacheArabArgentineanBarbadianBelgianBelizeanBhutaneseBlackfeetBritishBritish West IndianBurmeseCanadianCentral AmericanCentral American IndianCherokeeChileanColombianCroatianCubanCzechCzechoslovakianDanishDominicanDutchEastern EuropeanEcuadorianEgyptianEnglishEthiopianEuropeanFinnishFrenchFrench CanadianGermanGhanaianGreekGuamanian / ChamorroGuatemalanGuyaneseHaitianHonduranHungarianIndian (Asian)IranianIraqiIrishIroquoisIsraeliItalianJamaicanJapaneseKoreanLaotianLebaneseLithuanianMexicanMexican American IndianMoroccanNative HawaiianNigerianNorthern EuropeanNorwegianPakistaniPanamanianPennsylvania GermanPolishPortuguesePuerto RicanRomanianRussianSalvadoranSamoanScandinavianScotch-IrishScottishSlavicSlovakSouth AmericanSpaniardSpanishSri LankanSubsaharan AfricanSwedishSwissSyrianThaiTrinidadian and TobagonianUkrainianWelshWest IndianYugoslavian
Immigrant Origin (Total)
Immigrant Origin (Percentage)
Income
Income (Families)
Income (Households)
Poverty
Poverty (Families)
Unemployment
Employment Occupations
Employment Industries
Employer Class
Commute Time
Commute Means
School Enrollment
Education by Degree Field
Occupancy
Finances
Physical Characteristics
Hampton
Compare Zip Codes
Comparison Subject

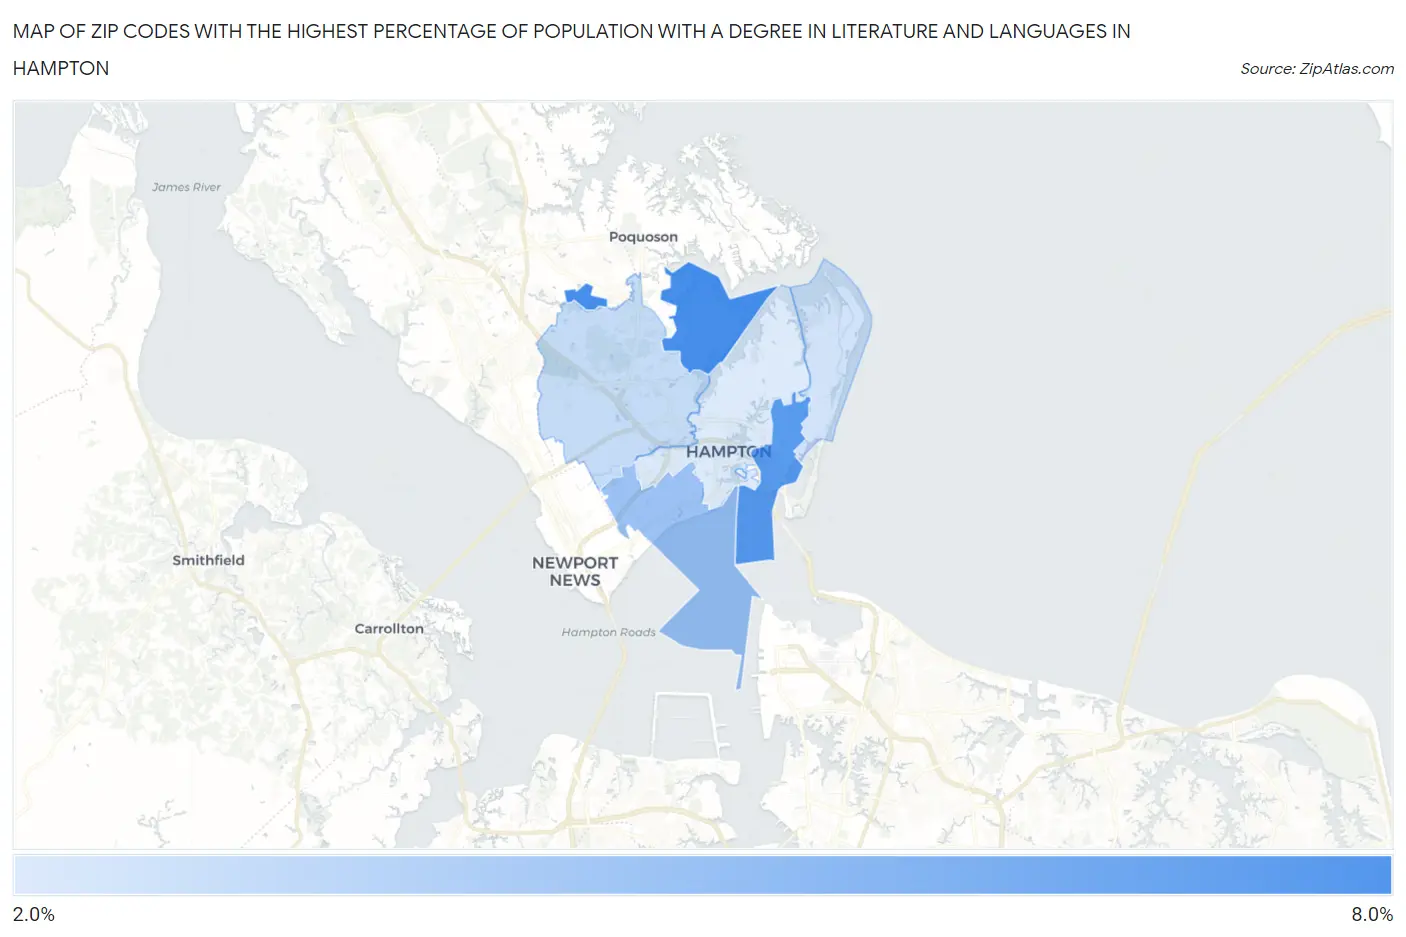
Map of Zip Codes with the Highest Percentage of Population with a Degree in Literature and Languages in Hampton

0.0%
8.0%
Zip Codes with the Highest Percentage of Population with a Degree in Literature and Languages in Hampton Map

Zip Codes with the Highest Percentage of Population with a Degree in Literature and Languages in Hampton, VA

Zip Code % Graduates vs State vs National
1.236656.6%5.2%(+1.38)#1854.4%(+2.22)#4,464
2.236636.2%5.2%(+0.945)#2174.4%(+1.78)#5,101
3.236614.2%5.2%(-1.02)#3584.4%(-0.181)#9,517
4.236663.1%5.2%(-2.12)#4604.4%(-1.28)#13,124
5.236642.8%5.2%(-2.45)#4834.4%(-1.61)#14,281
6.236692.5%5.2%(-2.77)#5024.4%(-1.93)#15,373

Common Questions

What are the Top 5 Zip Codes with the Highest Percentage of Population with a Degree in Literature and Languages in Hampton, VA?
Top 5 Zip Codes with the Highest Percentage of Population with a Degree in Literature and Languages in Hampton, VA are:
#1
6.6%
#2
6.2%
#3
4.2%
#4
3.1%
#5
2.8%
What zip code has the Highest Percentage of Population with a Degree in Literature and Languages in Hampton, VA?
23665 has the Highest Percentage of Population with a Degree in Literature and Languages in Hampton, VA with 6.6%.
What is the Percentage of Population with a Degree in Literature and Languages in Hampton, VA?
Percentage of Population with a Degree in Literature and Languages in Hampton is 3.3%.
What is the Percentage of Population with a Degree in Literature and Languages in Virginia?
Percentage of Population with a Degree in Literature and Languages in Virginia is 5.2%.
What is the Percentage of Population with a Degree in Literature and Languages in the United States?
Percentage of Population with a Degree in Literature and Languages in the United States is 4.4%.