Zip Codes with the Highest Percentage of Population Employed in Food Preparation & Serving in Hampton, VA
RELATED REPORTS & OPTIONS
Food Preparation & Serving
Hampton
Compare Zip Codes
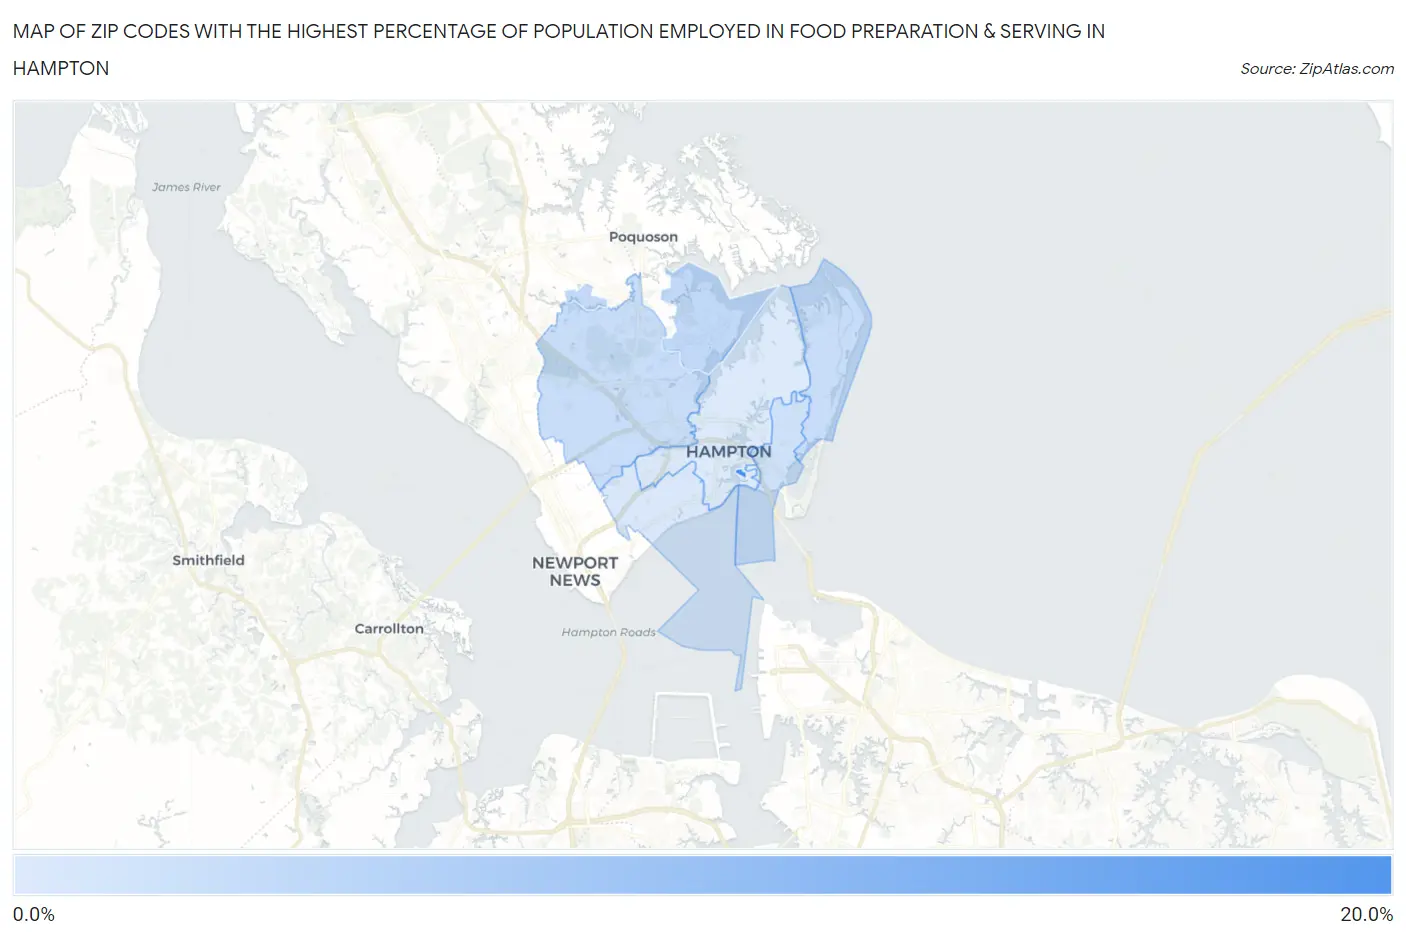
Map of Zip Codes with the Highest Percentage of Population Employed in Food Preparation & Serving in Hampton
3.4%
18.7%
Zip Codes with the Highest Percentage of Population Employed in Food Preparation & Serving in Hampton, VA
| Zip Code | % Employed | vs State | vs National | |
| 1. | 23668 | 18.7% | 4.8%(+13.9)#23 | 5.3%(+13.4)#597 |
| 2. | 23665 | 6.1% | 4.8%(+1.27)#209 | 5.3%(+0.772)#9,152 |
| 3. | 23664 | 5.4% | 4.8%(+0.615)#251 | 5.3%(+0.115)#11,403 |
| 4. | 23666 | 5.4% | 4.8%(+0.576)#255 | 5.3%(+0.076)#11,530 |
| 5. | 23663 | 4.8% | 4.8%(+0.053)#309 | 5.3%(-0.447)#13,609 |
| 6. | 23661 | 3.5% | 4.8%(-1.25)#461 | 5.3%(-1.75)#19,058 |
| 7. | 23669 | 3.4% | 4.8%(-1.38)#474 | 5.3%(-1.87)#19,571 |
1
Common Questions
What are the Top 5 Zip Codes with the Highest Percentage of Population Employed in Food Preparation & Serving in Hampton, VA?
Top 5 Zip Codes with the Highest Percentage of Population Employed in Food Preparation & Serving in Hampton, VA are:
What zip code has the Highest Percentage of Population Employed in Food Preparation & Serving in Hampton, VA?
23668 has the Highest Percentage of Population Employed in Food Preparation & Serving in Hampton, VA with 18.7%.
What is the Percentage of Population Employed in Food Preparation & Serving in Hampton, VA?
Percentage of Population Employed in Food Preparation & Serving in Hampton is 4.8%.
What is the Percentage of Population Employed in Food Preparation & Serving in Virginia?
Percentage of Population Employed in Food Preparation & Serving in Virginia is 4.8%.
What is the Percentage of Population Employed in Food Preparation & Serving in the United States?
Percentage of Population Employed in Food Preparation & Serving in the United States is 5.3%.