Zip Codes with the Highest Percentage of Population with a Degree in Visual and Performing Arts in Hampton, VA
RELATED REPORTS & OPTIONS
Visual and Performing Arts
Hampton
Compare Zip Codes
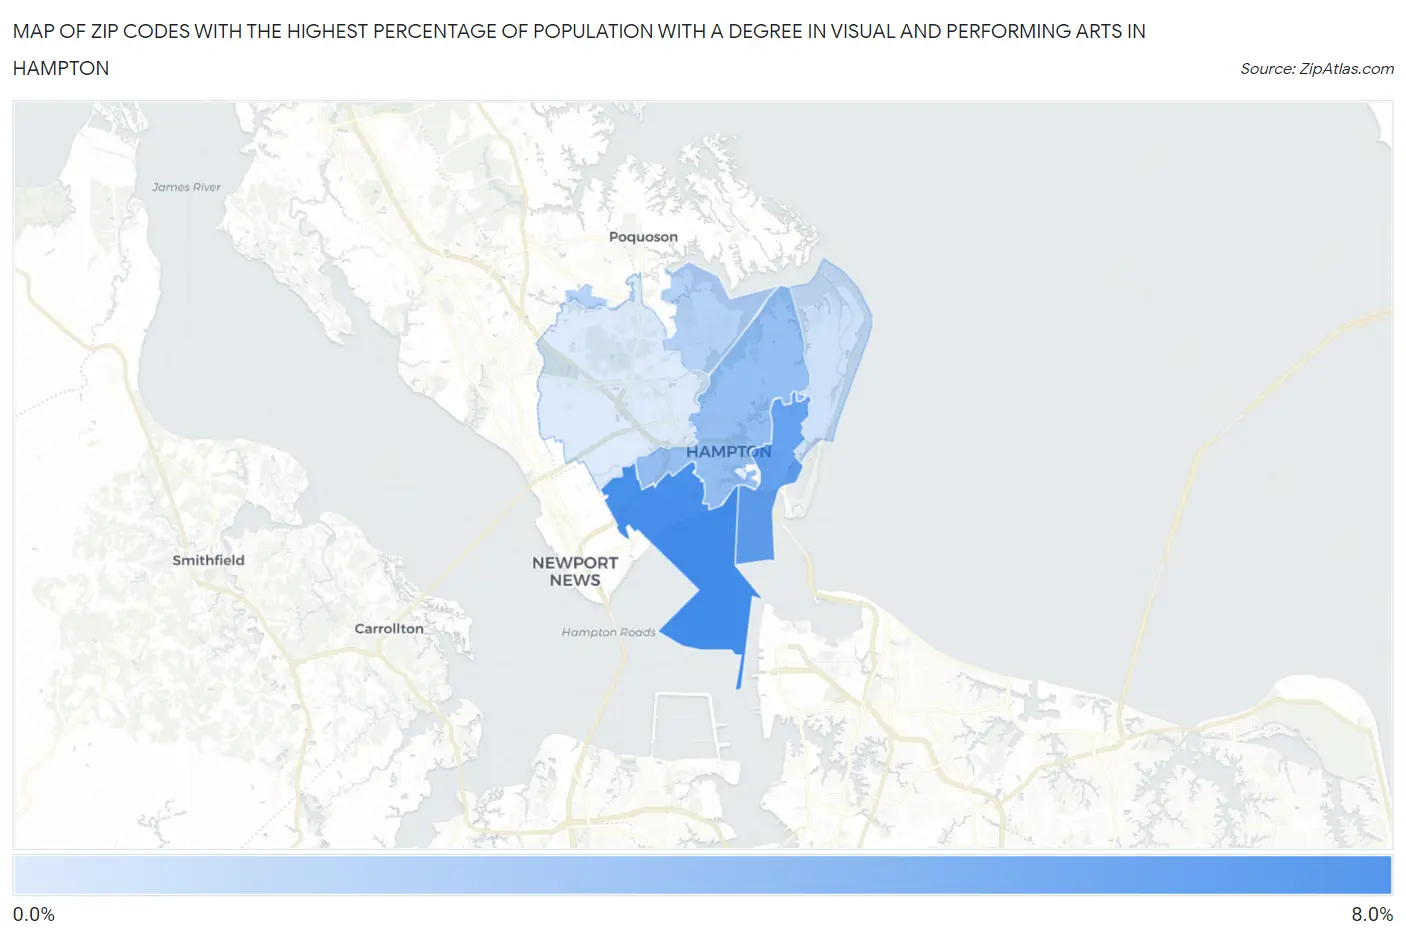
Map of Zip Codes with the Highest Percentage of Population with a Degree in Visual and Performing Arts in Hampton
0.94%
6.5%
Zip Codes with the Highest Percentage of Population with a Degree in Visual and Performing Arts in Hampton, VA
| Zip Code | % Graduates | vs State | vs National | |
| 1. | 23661 | 6.5% | 3.7%(+2.77)#112 | 4.3%(+2.24)#4,238 |
| 2. | 23663 | 5.4% | 3.7%(+1.65)#152 | 4.3%(+1.11)#5,919 |
| 3. | 23669 | 3.6% | 3.7%(-0.131)#274 | 4.3%(-0.667)#10,545 |
| 4. | 23665 | 2.3% | 3.7%(-1.37)#431 | 4.3%(-1.91)#15,187 |
| 5. | 23664 | 1.4% | 3.7%(-2.30)#502 | 4.3%(-2.84)#18,412 |
| 6. | 23666 | 0.94% | 3.7%(-2.77)#530 | 4.3%(-3.31)#19,834 |
1
Common Questions
What are the Top 5 Zip Codes with the Highest Percentage of Population with a Degree in Visual and Performing Arts in Hampton, VA?
Top 5 Zip Codes with the Highest Percentage of Population with a Degree in Visual and Performing Arts in Hampton, VA are:
What zip code has the Highest Percentage of Population with a Degree in Visual and Performing Arts in Hampton, VA?
23661 has the Highest Percentage of Population with a Degree in Visual and Performing Arts in Hampton, VA with 6.5%.
What is the Percentage of Population with a Degree in Visual and Performing Arts in Hampton, VA?
Percentage of Population with a Degree in Visual and Performing Arts in Hampton is 2.8%.
What is the Percentage of Population with a Degree in Visual and Performing Arts in Virginia?
Percentage of Population with a Degree in Visual and Performing Arts in Virginia is 3.7%.
What is the Percentage of Population with a Degree in Visual and Performing Arts in the United States?
Percentage of Population with a Degree in Visual and Performing Arts in the United States is 4.3%.