Somali vs Immigrants from Syria Female Unemployment
COMPARE
Somali
Immigrants from Syria
Female Unemployment
Female Unemployment Comparison
Somalis
Immigrants from Syria
5.0%
FEMALE UNEMPLOYMENT
94.6/ 100
METRIC RATING
103rd/ 347
METRIC RANK
5.6%
FEMALE UNEMPLOYMENT
0.8/ 100
METRIC RATING
250th/ 347
METRIC RANK
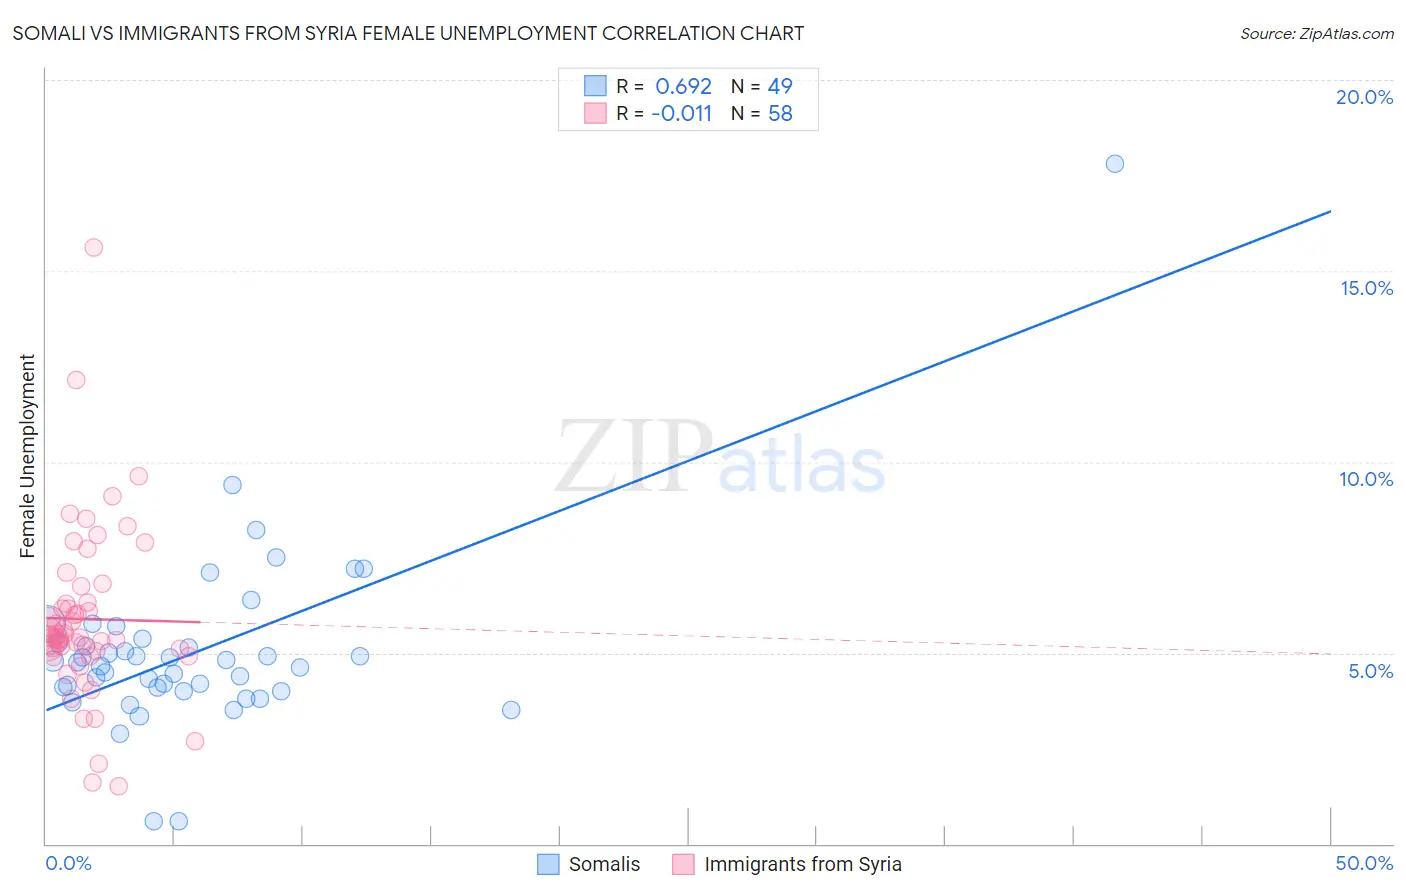
Somali vs Immigrants from Syria Female Unemployment Correlation Chart
The statistical analysis conducted on geographies consisting of 99,208,507 people shows a significant positive correlation between the proportion of Somalis and unemploymnet rate among females in the United States with a correlation coefficient (R) of 0.692 and weighted average of 5.0%. Similarly, the statistical analysis conducted on geographies consisting of 173,953,717 people shows no correlation between the proportion of Immigrants from Syria and unemploymnet rate among females in the United States with a correlation coefficient (R) of -0.011 and weighted average of 5.6%, a difference of 12.1%.
Female Unemployment Correlation Summary
| Measurement | Somali | Immigrants from Syria |
| Minimum | 0.60% | 1.5% |
| Maximum | 17.8% | 15.6% |
| Range | 17.2% | 14.1% |
| Mean | 5.0% | 5.9% |
| Median | 4.8% | 5.4% |
| Interquartile 25% (IQ1) | 4.0% | 5.0% |
| Interquartile 75% (IQ3) | 5.3% | 6.3% |
| Interquartile Range (IQR) | 1.3% | 1.3% |
| Standard Deviation (Sample) | 2.4% | 2.3% |
| Standard Deviation (Population) | 2.4% | 2.3% |
Similar Demographics by Female Unemployment
Demographics Similar to Somalis by Female Unemployment
In terms of female unemployment, the demographic groups most similar to Somalis are Immigrants from Kenya (5.0%, a difference of 0.080%), Immigrants from Czechoslovakia (5.0%, a difference of 0.13%), Indonesian (5.0%, a difference of 0.17%), Immigrants from Zaire (5.0%, a difference of 0.19%), and Immigrants from Somalia (5.0%, a difference of 0.20%).
| Demographics | Rating | Rank | Female Unemployment |
| Immigrants | South Central Asia | 95.5 /100 | #96 | Exceptional 5.0% |
| Immigrants | Somalia | 95.2 /100 | #97 | Exceptional 5.0% |
| Immigrants | Kuwait | 95.2 /100 | #98 | Exceptional 5.0% |
| Immigrants | Zaire | 95.2 /100 | #99 | Exceptional 5.0% |
| Indonesians | 95.1 /100 | #100 | Exceptional 5.0% |
| Immigrants | Czechoslovakia | 95.0 /100 | #101 | Exceptional 5.0% |
| Immigrants | Kenya | 94.8 /100 | #102 | Exceptional 5.0% |
| Somalis | 94.6 /100 | #103 | Exceptional 5.0% |
| Kenyans | 93.7 /100 | #104 | Exceptional 5.0% |
| Immigrants | England | 93.6 /100 | #105 | Exceptional 5.0% |
| Paraguayans | 93.2 /100 | #106 | Exceptional 5.1% |
| Immigrants | Switzerland | 93.1 /100 | #107 | Exceptional 5.1% |
| Puget Sound Salish | 93.0 /100 | #108 | Exceptional 5.1% |
| Immigrants | Eastern Africa | 92.8 /100 | #109 | Exceptional 5.1% |
| Macedonians | 92.4 /100 | #110 | Exceptional 5.1% |
Demographics Similar to Immigrants from Syria by Female Unemployment
In terms of female unemployment, the demographic groups most similar to Immigrants from Syria are Assyrian/Chaldean/Syriac (5.6%, a difference of 0.060%), Cajun (5.7%, a difference of 0.26%), Immigrants from Uzbekistan (5.6%, a difference of 0.29%), Cree (5.6%, a difference of 0.33%), and Immigrants from Sierra Leone (5.7%, a difference of 0.41%).
| Demographics | Rating | Rank | Female Unemployment |
| Spanish Americans | 2.2 /100 | #243 | Tragic 5.6% |
| Immigrants | Liberia | 1.5 /100 | #244 | Tragic 5.6% |
| Guamanians/Chamorros | 1.4 /100 | #245 | Tragic 5.6% |
| Japanese | 1.2 /100 | #246 | Tragic 5.6% |
| Immigrants | Western Asia | 1.1 /100 | #247 | Tragic 5.6% |
| Cree | 1.0 /100 | #248 | Tragic 5.6% |
| Immigrants | Uzbekistan | 1.0 /100 | #249 | Tragic 5.6% |
| Immigrants | Syria | 0.8 /100 | #250 | Tragic 5.6% |
| Assyrians/Chaldeans/Syriacs | 0.8 /100 | #251 | Tragic 5.6% |
| Cajuns | 0.7 /100 | #252 | Tragic 5.7% |
| Immigrants | Sierra Leone | 0.6 /100 | #253 | Tragic 5.7% |
| Immigrants | Immigrants | 0.6 /100 | #254 | Tragic 5.7% |
| Immigrants | Cameroon | 0.6 /100 | #255 | Tragic 5.7% |
| Sub-Saharan Africans | 0.4 /100 | #256 | Tragic 5.7% |
| Dutch West Indians | 0.3 /100 | #257 | Tragic 5.7% |