Somali vs Finnish Female Unemployment
COMPARE
Somali
Finnish
Female Unemployment
Female Unemployment Comparison
Somalis
Finns
5.0%
FEMALE UNEMPLOYMENT
94.6/ 100
METRIC RATING
103rd/ 347
METRIC RANK
4.6%
FEMALE UNEMPLOYMENT
100.0/ 100
METRIC RATING
14th/ 347
METRIC RANK
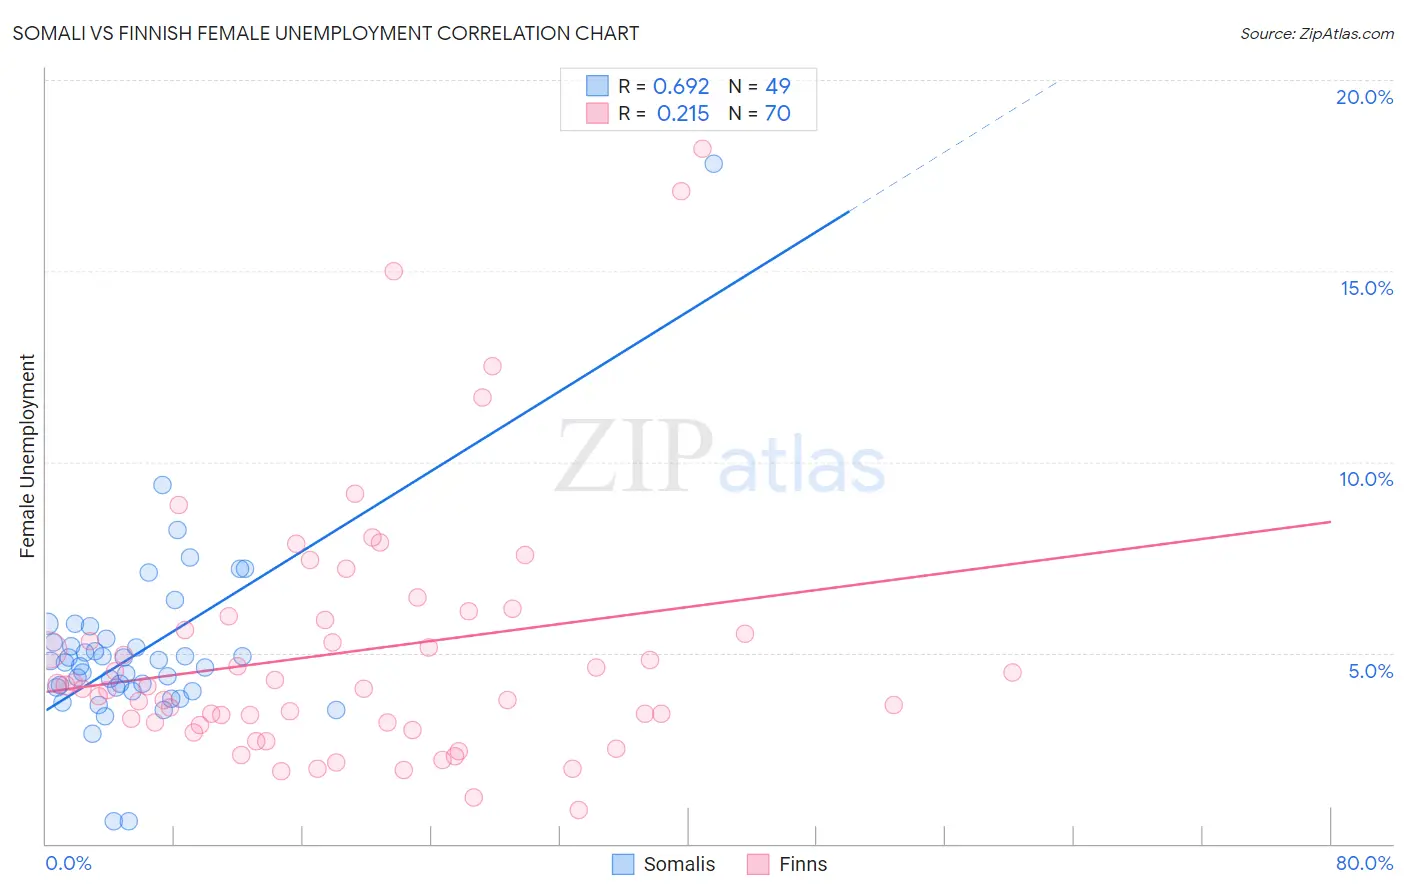
Somali vs Finnish Female Unemployment Correlation Chart
The statistical analysis conducted on geographies consisting of 99,208,507 people shows a significant positive correlation between the proportion of Somalis and unemploymnet rate among females in the United States with a correlation coefficient (R) of 0.692 and weighted average of 5.0%. Similarly, the statistical analysis conducted on geographies consisting of 401,070,094 people shows a weak positive correlation between the proportion of Finns and unemploymnet rate among females in the United States with a correlation coefficient (R) of 0.215 and weighted average of 4.6%, a difference of 8.8%.
Female Unemployment Correlation Summary
| Measurement | Somali | Finnish |
| Minimum | 0.60% | 0.90% |
| Maximum | 17.8% | 18.2% |
| Range | 17.2% | 17.3% |
| Mean | 5.0% | 5.0% |
| Median | 4.8% | 4.1% |
| Interquartile 25% (IQ1) | 4.0% | 3.2% |
| Interquartile 75% (IQ3) | 5.3% | 5.9% |
| Interquartile Range (IQR) | 1.3% | 2.7% |
| Standard Deviation (Sample) | 2.4% | 3.4% |
| Standard Deviation (Population) | 2.4% | 3.3% |
Similar Demographics by Female Unemployment
Demographics Similar to Somalis by Female Unemployment
In terms of female unemployment, the demographic groups most similar to Somalis are Immigrants from Kenya (5.0%, a difference of 0.080%), Immigrants from Czechoslovakia (5.0%, a difference of 0.13%), Indonesian (5.0%, a difference of 0.17%), Immigrants from Zaire (5.0%, a difference of 0.19%), and Immigrants from Somalia (5.0%, a difference of 0.20%).
| Demographics | Rating | Rank | Female Unemployment |
| Immigrants | South Central Asia | 95.5 /100 | #96 | Exceptional 5.0% |
| Immigrants | Somalia | 95.2 /100 | #97 | Exceptional 5.0% |
| Immigrants | Kuwait | 95.2 /100 | #98 | Exceptional 5.0% |
| Immigrants | Zaire | 95.2 /100 | #99 | Exceptional 5.0% |
| Indonesians | 95.1 /100 | #100 | Exceptional 5.0% |
| Immigrants | Czechoslovakia | 95.0 /100 | #101 | Exceptional 5.0% |
| Immigrants | Kenya | 94.8 /100 | #102 | Exceptional 5.0% |
| Somalis | 94.6 /100 | #103 | Exceptional 5.0% |
| Kenyans | 93.7 /100 | #104 | Exceptional 5.0% |
| Immigrants | England | 93.6 /100 | #105 | Exceptional 5.0% |
| Paraguayans | 93.2 /100 | #106 | Exceptional 5.1% |
| Immigrants | Switzerland | 93.1 /100 | #107 | Exceptional 5.1% |
| Puget Sound Salish | 93.0 /100 | #108 | Exceptional 5.1% |
| Immigrants | Eastern Africa | 92.8 /100 | #109 | Exceptional 5.1% |
| Macedonians | 92.4 /100 | #110 | Exceptional 5.1% |
Demographics Similar to Finns by Female Unemployment
In terms of female unemployment, the demographic groups most similar to Finns are English (4.6%, a difference of 0.20%), Belgian (4.6%, a difference of 0.59%), Dutch (4.6%, a difference of 0.75%), Carpatho Rusyn (4.7%, a difference of 1.1%), and Croatian (4.7%, a difference of 1.1%).
| Demographics | Rating | Rank | Female Unemployment |
| Chinese | 100.0 /100 | #7 | Exceptional 4.5% |
| Germans | 100.0 /100 | #8 | Exceptional 4.5% |
| Slovenes | 100.0 /100 | #9 | Exceptional 4.5% |
| Swiss | 100.0 /100 | #10 | Exceptional 4.6% |
| Scandinavians | 100.0 /100 | #11 | Exceptional 4.6% |
| Dutch | 100.0 /100 | #12 | Exceptional 4.6% |
| Belgians | 100.0 /100 | #13 | Exceptional 4.6% |
| Finns | 100.0 /100 | #14 | Exceptional 4.6% |
| English | 100.0 /100 | #15 | Exceptional 4.6% |
| Carpatho Rusyns | 99.9 /100 | #16 | Exceptional 4.7% |
| Croatians | 99.9 /100 | #17 | Exceptional 4.7% |
| Latvians | 99.9 /100 | #18 | Exceptional 4.7% |
| Poles | 99.9 /100 | #19 | Exceptional 4.7% |
| Bulgarians | 99.9 /100 | #20 | Exceptional 4.7% |
| Fijians | 99.9 /100 | #21 | Exceptional 4.7% |