Somali vs Menominee Female Unemployment
COMPARE
Somali
Menominee
Female Unemployment
Female Unemployment Comparison
Somalis
Menominee
5.0%
FEMALE UNEMPLOYMENT
94.6/ 100
METRIC RATING
103rd/ 347
METRIC RANK
7.0%
FEMALE UNEMPLOYMENT
0.0/ 100
METRIC RATING
333rd/ 347
METRIC RANK
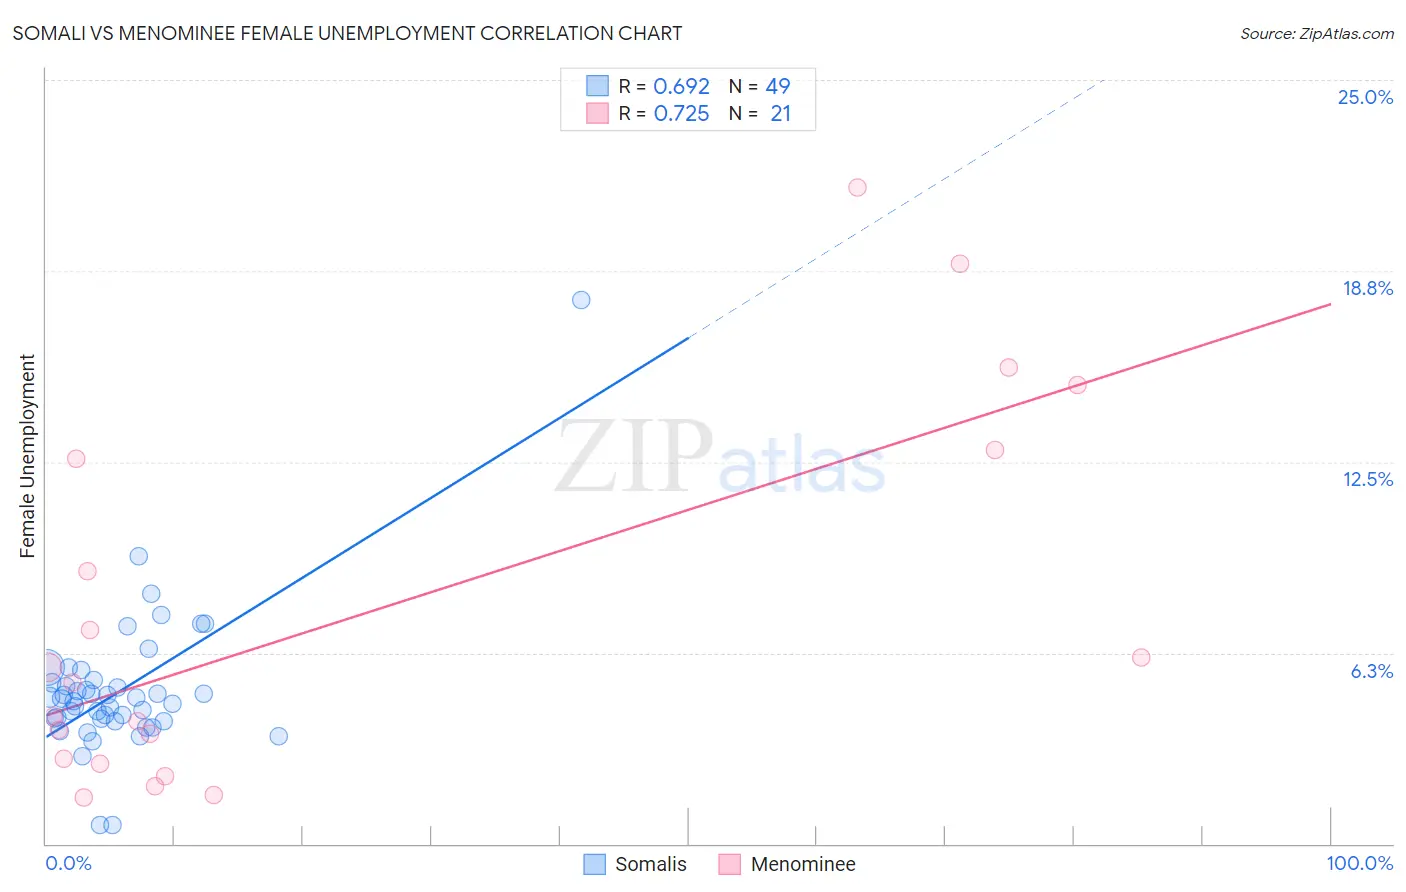
Somali vs Menominee Female Unemployment Correlation Chart
The statistical analysis conducted on geographies consisting of 99,208,507 people shows a significant positive correlation between the proportion of Somalis and unemploymnet rate among females in the United States with a correlation coefficient (R) of 0.692 and weighted average of 5.0%. Similarly, the statistical analysis conducted on geographies consisting of 45,628,171 people shows a strong positive correlation between the proportion of Menominee and unemploymnet rate among females in the United States with a correlation coefficient (R) of 0.725 and weighted average of 7.0%, a difference of 40.0%.
Female Unemployment Correlation Summary
| Measurement | Somali | Menominee |
| Minimum | 0.60% | 1.5% |
| Maximum | 17.8% | 21.5% |
| Range | 17.2% | 20.0% |
| Mean | 5.0% | 7.5% |
| Median | 4.8% | 5.3% |
| Interquartile 25% (IQ1) | 4.0% | 2.7% |
| Interquartile 75% (IQ3) | 5.3% | 12.7% |
| Interquartile Range (IQR) | 1.3% | 10.0% |
| Standard Deviation (Sample) | 2.4% | 6.1% |
| Standard Deviation (Population) | 2.4% | 6.0% |
Similar Demographics by Female Unemployment
Demographics Similar to Somalis by Female Unemployment
In terms of female unemployment, the demographic groups most similar to Somalis are Immigrants from Kenya (5.0%, a difference of 0.080%), Immigrants from Czechoslovakia (5.0%, a difference of 0.13%), Indonesian (5.0%, a difference of 0.17%), Immigrants from Zaire (5.0%, a difference of 0.19%), and Immigrants from Somalia (5.0%, a difference of 0.20%).
| Demographics | Rating | Rank | Female Unemployment |
| Immigrants | South Central Asia | 95.5 /100 | #96 | Exceptional 5.0% |
| Immigrants | Somalia | 95.2 /100 | #97 | Exceptional 5.0% |
| Immigrants | Kuwait | 95.2 /100 | #98 | Exceptional 5.0% |
| Immigrants | Zaire | 95.2 /100 | #99 | Exceptional 5.0% |
| Indonesians | 95.1 /100 | #100 | Exceptional 5.0% |
| Immigrants | Czechoslovakia | 95.0 /100 | #101 | Exceptional 5.0% |
| Immigrants | Kenya | 94.8 /100 | #102 | Exceptional 5.0% |
| Somalis | 94.6 /100 | #103 | Exceptional 5.0% |
| Kenyans | 93.7 /100 | #104 | Exceptional 5.0% |
| Immigrants | England | 93.6 /100 | #105 | Exceptional 5.0% |
| Paraguayans | 93.2 /100 | #106 | Exceptional 5.1% |
| Immigrants | Switzerland | 93.1 /100 | #107 | Exceptional 5.1% |
| Puget Sound Salish | 93.0 /100 | #108 | Exceptional 5.1% |
| Immigrants | Eastern Africa | 92.8 /100 | #109 | Exceptional 5.1% |
| Macedonians | 92.4 /100 | #110 | Exceptional 5.1% |
Demographics Similar to Menominee by Female Unemployment
In terms of female unemployment, the demographic groups most similar to Menominee are Sioux (7.0%, a difference of 0.020%), Immigrants from Armenia (7.1%, a difference of 0.41%), Dominican (7.2%, a difference of 1.8%), Immigrants from Dominican Republic (7.2%, a difference of 2.5%), and Navajo (7.3%, a difference of 3.5%).
| Demographics | Rating | Rank | Female Unemployment |
| Natives/Alaskans | 0.0 /100 | #326 | Tragic 6.6% |
| Alaska Natives | 0.0 /100 | #327 | Tragic 6.6% |
| Guyanese | 0.0 /100 | #328 | Tragic 6.7% |
| Immigrants | Guyana | 0.0 /100 | #329 | Tragic 6.7% |
| Yakama | 0.0 /100 | #330 | Tragic 6.7% |
| Paiute | 0.0 /100 | #331 | Tragic 6.8% |
| Sioux | 0.0 /100 | #332 | Tragic 7.0% |
| Menominee | 0.0 /100 | #333 | Tragic 7.0% |
| Immigrants | Armenia | 0.0 /100 | #334 | Tragic 7.1% |
| Dominicans | 0.0 /100 | #335 | Tragic 7.2% |
| Immigrants | Dominican Republic | 0.0 /100 | #336 | Tragic 7.2% |
| Navajo | 0.0 /100 | #337 | Tragic 7.3% |
| Tohono O'odham | 0.0 /100 | #338 | Tragic 7.7% |
| Immigrants | Yemen | 0.0 /100 | #339 | Tragic 7.8% |
| Hopi | 0.0 /100 | #340 | Tragic 8.1% |