Czech vs Immigrants from Syria Female Unemployment
COMPARE
Czech
Immigrants from Syria
Female Unemployment
Female Unemployment Comparison
Czechs
Immigrants from Syria
4.4%
FEMALE UNEMPLOYMENT
100.0/ 100
METRIC RATING
2nd/ 347
METRIC RANK
5.6%
FEMALE UNEMPLOYMENT
0.8/ 100
METRIC RATING
250th/ 347
METRIC RANK
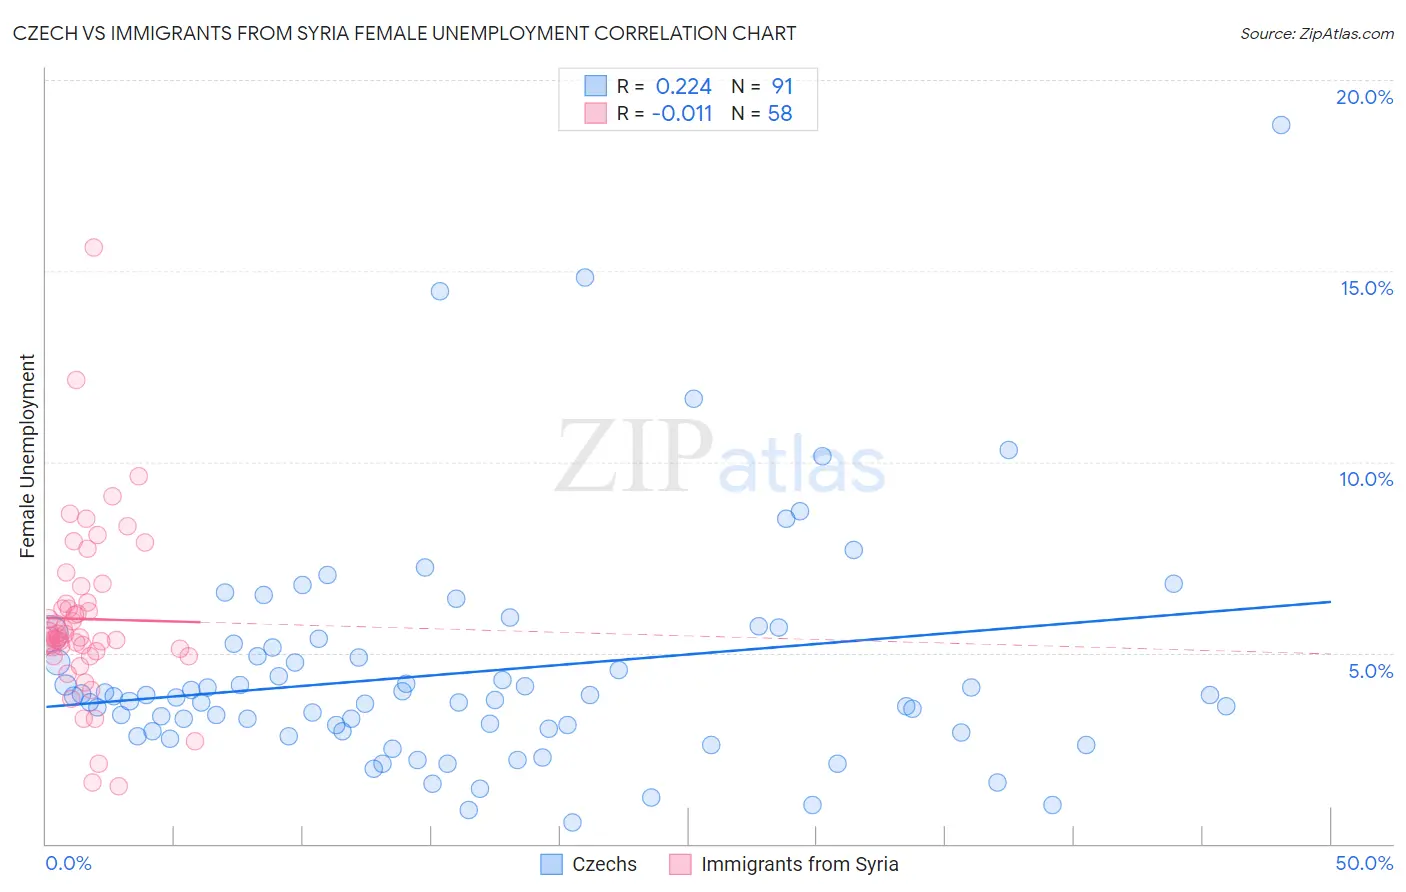
Czech vs Immigrants from Syria Female Unemployment Correlation Chart
The statistical analysis conducted on geographies consisting of 478,075,637 people shows a weak positive correlation between the proportion of Czechs and unemploymnet rate among females in the United States with a correlation coefficient (R) of 0.224 and weighted average of 4.4%. Similarly, the statistical analysis conducted on geographies consisting of 173,953,717 people shows no correlation between the proportion of Immigrants from Syria and unemploymnet rate among females in the United States with a correlation coefficient (R) of -0.011 and weighted average of 5.6%, a difference of 28.5%.
Female Unemployment Correlation Summary
| Measurement | Czech | Immigrants from Syria |
| Minimum | 0.54% | 1.5% |
| Maximum | 18.8% | 15.6% |
| Range | 18.3% | 14.1% |
| Mean | 4.5% | 5.9% |
| Median | 3.8% | 5.4% |
| Interquartile 25% (IQ1) | 3.0% | 5.0% |
| Interquartile 75% (IQ3) | 5.1% | 6.3% |
| Interquartile Range (IQR) | 2.2% | 1.3% |
| Standard Deviation (Sample) | 3.0% | 2.3% |
| Standard Deviation (Population) | 3.0% | 2.3% |
Similar Demographics by Female Unemployment
Demographics Similar to Czechs by Female Unemployment
In terms of female unemployment, the demographic groups most similar to Czechs are Luxembourger (4.4%, a difference of 0.010%), Danish (4.4%, a difference of 0.040%), Hmong (4.4%, a difference of 0.15%), Swedish (4.4%, a difference of 1.4%), and Chinese (4.5%, a difference of 2.2%).
| Demographics | Rating | Rank | Female Unemployment |
| Norwegians | 100.0 /100 | #1 | Exceptional 4.2% |
| Czechs | 100.0 /100 | #2 | Exceptional 4.4% |
| Luxembourgers | 100.0 /100 | #3 | Exceptional 4.4% |
| Danes | 100.0 /100 | #4 | Exceptional 4.4% |
| Hmong | 100.0 /100 | #5 | Exceptional 4.4% |
| Swedes | 100.0 /100 | #6 | Exceptional 4.4% |
| Chinese | 100.0 /100 | #7 | Exceptional 4.5% |
| Germans | 100.0 /100 | #8 | Exceptional 4.5% |
| Slovenes | 100.0 /100 | #9 | Exceptional 4.5% |
| Swiss | 100.0 /100 | #10 | Exceptional 4.6% |
| Scandinavians | 100.0 /100 | #11 | Exceptional 4.6% |
| Dutch | 100.0 /100 | #12 | Exceptional 4.6% |
| Belgians | 100.0 /100 | #13 | Exceptional 4.6% |
| Finns | 100.0 /100 | #14 | Exceptional 4.6% |
| English | 100.0 /100 | #15 | Exceptional 4.6% |
Demographics Similar to Immigrants from Syria by Female Unemployment
In terms of female unemployment, the demographic groups most similar to Immigrants from Syria are Assyrian/Chaldean/Syriac (5.6%, a difference of 0.060%), Cajun (5.7%, a difference of 0.26%), Immigrants from Uzbekistan (5.6%, a difference of 0.29%), Cree (5.6%, a difference of 0.33%), and Immigrants from Sierra Leone (5.7%, a difference of 0.41%).
| Demographics | Rating | Rank | Female Unemployment |
| Spanish Americans | 2.2 /100 | #243 | Tragic 5.6% |
| Immigrants | Liberia | 1.5 /100 | #244 | Tragic 5.6% |
| Guamanians/Chamorros | 1.4 /100 | #245 | Tragic 5.6% |
| Japanese | 1.2 /100 | #246 | Tragic 5.6% |
| Immigrants | Western Asia | 1.1 /100 | #247 | Tragic 5.6% |
| Cree | 1.0 /100 | #248 | Tragic 5.6% |
| Immigrants | Uzbekistan | 1.0 /100 | #249 | Tragic 5.6% |
| Immigrants | Syria | 0.8 /100 | #250 | Tragic 5.6% |
| Assyrians/Chaldeans/Syriacs | 0.8 /100 | #251 | Tragic 5.6% |
| Cajuns | 0.7 /100 | #252 | Tragic 5.7% |
| Immigrants | Sierra Leone | 0.6 /100 | #253 | Tragic 5.7% |
| Immigrants | Immigrants | 0.6 /100 | #254 | Tragic 5.7% |
| Immigrants | Cameroon | 0.6 /100 | #255 | Tragic 5.7% |
| Sub-Saharan Africans | 0.4 /100 | #256 | Tragic 5.7% |
| Dutch West Indians | 0.3 /100 | #257 | Tragic 5.7% |