Somali vs Immigrants from Syria Seniors Poverty Over the Age of 75
COMPARE
Somali
Immigrants from Syria
Seniors Poverty Over the Age of 75
Seniors Poverty Over the Age of 75 Comparison
Somalis
Immigrants from Syria
13.2%
SENIORS POVERTY OVER THE AGE OF 75
1.6/ 100
METRIC RATING
229th/ 347
METRIC RANK
12.2%
SENIORS POVERTY OVER THE AGE OF 75
53.9/ 100
METRIC RATING
168th/ 347
METRIC RANK
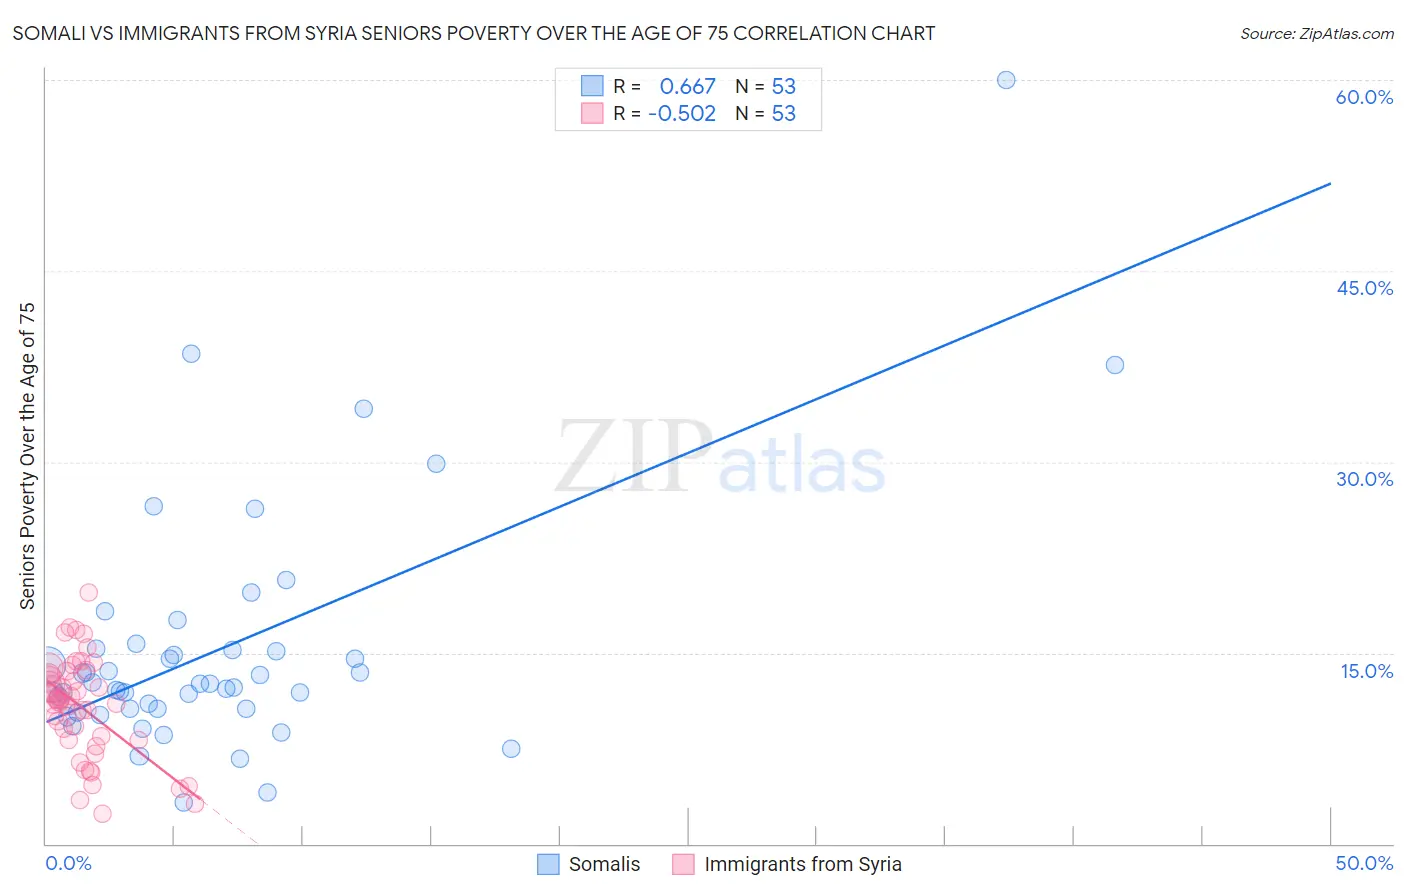
Somali vs Immigrants from Syria Seniors Poverty Over the Age of 75 Correlation Chart
The statistical analysis conducted on geographies consisting of 98,878,805 people shows a significant positive correlation between the proportion of Somalis and poverty level among seniors over the age of 75 in the United States with a correlation coefficient (R) of 0.667 and weighted average of 13.2%. Similarly, the statistical analysis conducted on geographies consisting of 173,460,878 people shows a substantial negative correlation between the proportion of Immigrants from Syria and poverty level among seniors over the age of 75 in the United States with a correlation coefficient (R) of -0.502 and weighted average of 12.2%, a difference of 8.7%.
Seniors Poverty Over the Age of 75 Correlation Summary
| Measurement | Somali | Immigrants from Syria |
| Minimum | 3.2% | 2.4% |
| Maximum | 60.0% | 19.7% |
| Range | 56.8% | 17.4% |
| Mean | 15.3% | 10.7% |
| Median | 12.6% | 11.3% |
| Interquartile 25% (IQ1) | 10.6% | 8.2% |
| Interquartile 75% (IQ3) | 15.3% | 13.4% |
| Interquartile Range (IQR) | 4.7% | 5.2% |
| Standard Deviation (Sample) | 9.7% | 3.9% |
| Standard Deviation (Population) | 9.6% | 3.9% |
Similar Demographics by Seniors Poverty Over the Age of 75
Demographics Similar to Somalis by Seniors Poverty Over the Age of 75
In terms of seniors poverty over the age of 75, the demographic groups most similar to Somalis are Immigrants from China (13.2%, a difference of 0.080%), Subsaharan African (13.2%, a difference of 0.090%), Immigrants from Chile (13.3%, a difference of 0.30%), Immigrants from Costa Rica (13.3%, a difference of 0.33%), and Israeli (13.2%, a difference of 0.44%).
| Demographics | Rating | Rank | Seniors Poverty Over the Age of 75 |
| Nigerians | 3.4 /100 | #222 | Tragic 13.0% |
| Immigrants | Nigeria | 3.3 /100 | #223 | Tragic 13.0% |
| Chippewa | 2.9 /100 | #224 | Tragic 13.1% |
| Immigrants | Morocco | 2.8 /100 | #225 | Tragic 13.1% |
| Shoshone | 2.6 /100 | #226 | Tragic 13.1% |
| Cree | 2.3 /100 | #227 | Tragic 13.1% |
| Israelis | 2.0 /100 | #228 | Tragic 13.2% |
| Somalis | 1.6 /100 | #229 | Tragic 13.2% |
| Immigrants | China | 1.5 /100 | #230 | Tragic 13.2% |
| Sub-Saharan Africans | 1.5 /100 | #231 | Tragic 13.2% |
| Immigrants | Chile | 1.3 /100 | #232 | Tragic 13.3% |
| Immigrants | Costa Rica | 1.3 /100 | #233 | Tragic 13.3% |
| Immigrants | Israel | 1.1 /100 | #234 | Tragic 13.3% |
| Japanese | 0.9 /100 | #235 | Tragic 13.3% |
| Moroccans | 0.9 /100 | #236 | Tragic 13.3% |
Demographics Similar to Immigrants from Syria by Seniors Poverty Over the Age of 75
In terms of seniors poverty over the age of 75, the demographic groups most similar to Immigrants from Syria are Immigrants from Egypt (12.2%, a difference of 0.010%), Immigrants from Switzerland (12.1%, a difference of 0.050%), Egyptian (12.1%, a difference of 0.080%), Immigrants from Thailand (12.2%, a difference of 0.15%), and Spaniard (12.2%, a difference of 0.19%).
| Demographics | Rating | Rank | Seniors Poverty Over the Age of 75 |
| Immigrants | Norway | 60.6 /100 | #161 | Good 12.1% |
| Immigrants | Serbia | 60.2 /100 | #162 | Good 12.1% |
| Immigrants | Greece | 58.2 /100 | #163 | Average 12.1% |
| Potawatomi | 57.4 /100 | #164 | Average 12.1% |
| Okinawans | 56.3 /100 | #165 | Average 12.1% |
| Egyptians | 54.8 /100 | #166 | Average 12.1% |
| Immigrants | Switzerland | 54.5 /100 | #167 | Average 12.1% |
| Immigrants | Syria | 53.9 /100 | #168 | Average 12.2% |
| Immigrants | Egypt | 53.7 /100 | #169 | Average 12.2% |
| Immigrants | Thailand | 52.0 /100 | #170 | Average 12.2% |
| Spaniards | 51.6 /100 | #171 | Average 12.2% |
| Immigrants | Fiji | 51.5 /100 | #172 | Average 12.2% |
| Arabs | 50.5 /100 | #173 | Average 12.2% |
| Immigrants | Europe | 50.0 /100 | #174 | Average 12.2% |
| Immigrants | Saudi Arabia | 49.5 /100 | #175 | Average 12.2% |