Czech vs Laotian Unemployment
COMPARE
Czech
Laotian
Unemployment
Unemployment Comparison
Czechs
Laotians
4.3%
UNEMPLOYMENT
100.0/ 100
METRIC RATING
3rd/ 347
METRIC RANK
5.2%
UNEMPLOYMENT
66.3/ 100
METRIC RATING
160th/ 347
METRIC RANK
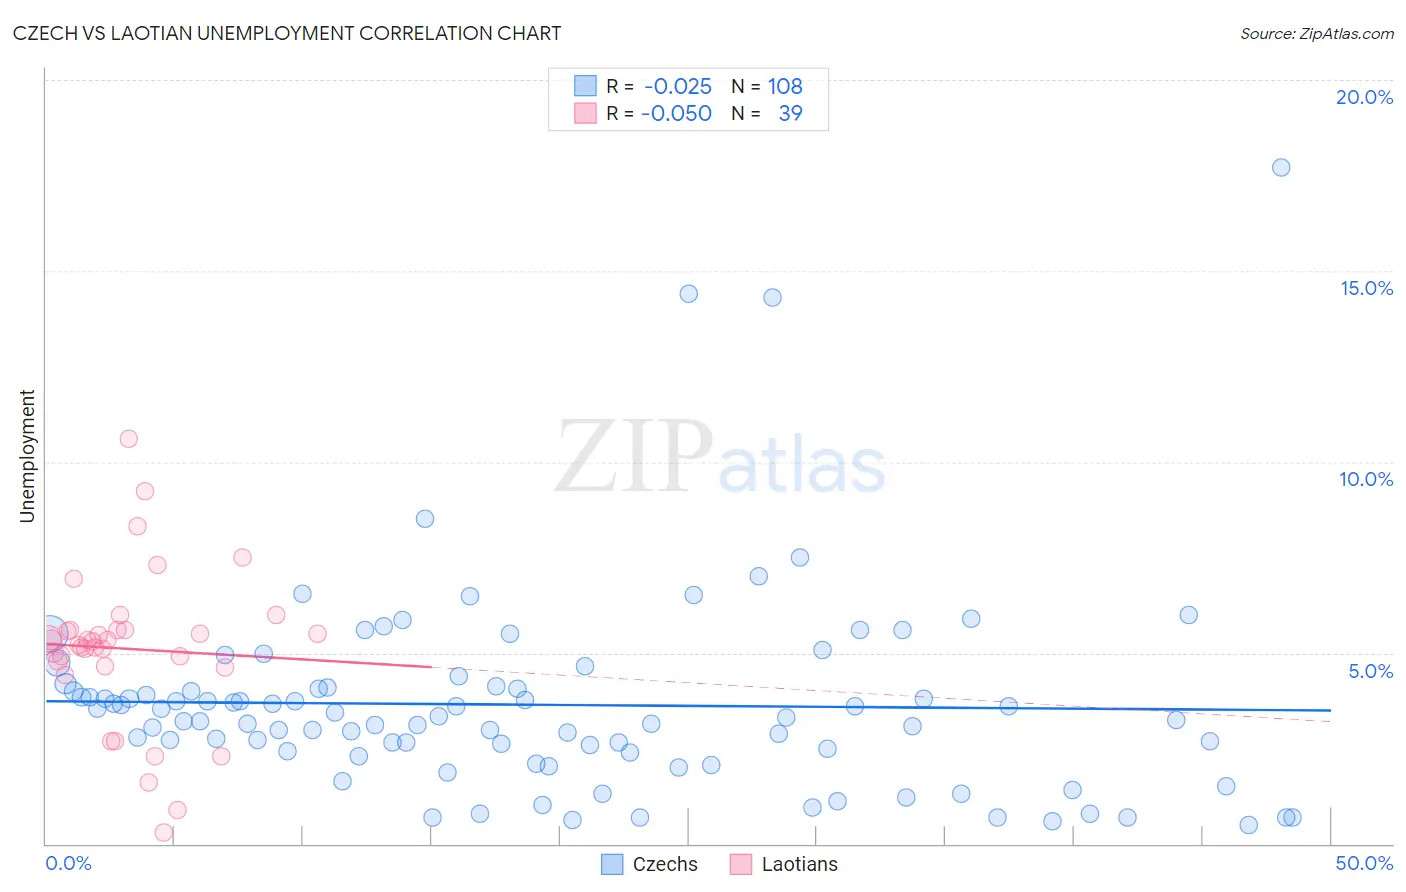
Czech vs Laotian Unemployment Correlation Chart
The statistical analysis conducted on geographies consisting of 483,205,861 people shows no correlation between the proportion of Czechs and unemployment in the United States with a correlation coefficient (R) of -0.025 and weighted average of 4.3%. Similarly, the statistical analysis conducted on geographies consisting of 224,771,709 people shows a slight negative correlation between the proportion of Laotians and unemployment in the United States with a correlation coefficient (R) of -0.050 and weighted average of 5.2%, a difference of 19.8%.
Unemployment Correlation Summary
| Measurement | Czech | Laotian |
| Minimum | 0.50% | 0.30% |
| Maximum | 17.7% | 10.6% |
| Range | 17.2% | 10.3% |
| Mean | 3.6% | 5.1% |
| Median | 3.3% | 5.3% |
| Interquartile 25% (IQ1) | 2.4% | 4.7% |
| Interquartile 75% (IQ3) | 4.1% | 5.6% |
| Interquartile Range (IQR) | 1.7% | 0.94% |
| Standard Deviation (Sample) | 2.6% | 2.0% |
| Standard Deviation (Population) | 2.6% | 2.0% |
Similar Demographics by Unemployment
Demographics Similar to Czechs by Unemployment
In terms of unemployment, the demographic groups most similar to Czechs are Luxembourger (4.3%, a difference of 0.10%), Danish (4.3%, a difference of 0.15%), Swedish (4.4%, a difference of 2.5%), German (4.5%, a difference of 3.3%), and Norwegian (4.2%, a difference of 3.5%).
| Demographics | Rating | Rank | Unemployment |
| Norwegians | 100.0 /100 | #1 | Exceptional 4.2% |
| Luxembourgers | 100.0 /100 | #2 | Exceptional 4.3% |
| Czechs | 100.0 /100 | #3 | Exceptional 4.3% |
| Danes | 100.0 /100 | #4 | Exceptional 4.3% |
| Swedes | 100.0 /100 | #5 | Exceptional 4.4% |
| Germans | 100.0 /100 | #6 | Exceptional 4.5% |
| Immigrants | India | 100.0 /100 | #7 | Exceptional 4.5% |
| Swiss | 100.0 /100 | #8 | Exceptional 4.5% |
| Scandinavians | 100.0 /100 | #9 | Exceptional 4.5% |
| Dutch | 100.0 /100 | #10 | Exceptional 4.6% |
| English | 100.0 /100 | #11 | Exceptional 4.6% |
| Pennsylvania Germans | 100.0 /100 | #12 | Exceptional 4.6% |
| Belgians | 100.0 /100 | #13 | Exceptional 4.6% |
| Immigrants | Cuba | 100.0 /100 | #14 | Exceptional 4.6% |
| Europeans | 99.9 /100 | #15 | Exceptional 4.6% |
Demographics Similar to Laotians by Unemployment
In terms of unemployment, the demographic groups most similar to Laotians are Immigrants from Egypt (5.2%, a difference of 0.020%), Immigrants from Russia (5.2%, a difference of 0.020%), Immigrants from Oceania (5.2%, a difference of 0.080%), Spanish (5.2%, a difference of 0.090%), and Immigrants from Zaire (5.2%, a difference of 0.11%).
| Demographics | Rating | Rank | Unemployment |
| Egyptians | 75.2 /100 | #153 | Good 5.2% |
| Immigrants | China | 74.7 /100 | #154 | Good 5.2% |
| Immigrants | Northern Africa | 71.3 /100 | #155 | Good 5.2% |
| Immigrants | Kazakhstan | 70.4 /100 | #156 | Good 5.2% |
| Sri Lankans | 69.5 /100 | #157 | Good 5.2% |
| Immigrants | Egypt | 66.7 /100 | #158 | Good 5.2% |
| Immigrants | Russia | 66.6 /100 | #159 | Good 5.2% |
| Laotians | 66.3 /100 | #160 | Good 5.2% |
| Immigrants | Oceania | 65.2 /100 | #161 | Good 5.2% |
| Spanish | 65.1 /100 | #162 | Good 5.2% |
| Immigrants | Zaire | 64.7 /100 | #163 | Good 5.2% |
| Immigrants | Colombia | 64.7 /100 | #164 | Good 5.2% |
| Immigrants | Brazil | 63.1 /100 | #165 | Good 5.2% |
| Immigrants | Indonesia | 61.2 /100 | #166 | Good 5.2% |
| Colombians | 61.1 /100 | #167 | Good 5.2% |