Brazilian vs Laotian Unemployment

COMPARE

Brazilian
Race
Ancestry
AfghanAfricanAlaska NativeAlaskan AthabascanAlbanianAleutAlsatianAmericanApacheArabArapahoArgentineanArmenianAssyrian/Chaldean/SyriacAustralianAustrianBahamianBangladeshiBarbadianBasqueBelgianBelizeanBermudanBhutaneseBlackfeetBolivianBrazilianBritishBritish West IndianBulgarianBurmeseCajunCambodianCanadianCape VerdeanCarpatho RusynCelticCentral AmericanCentral American IndianCherokeeCheyenneChickasawChileanChineseChippewaChoctawColombianColvilleComancheCosta RicanCreeCreekCroatianCrowCubanCypriotCzechCzechoslovakianDanishDelawareDominicanDutchDutch West IndianEastern EuropeanEcuadorianEgyptianEnglishEstonianEthiopianEuropeanFijianFilipinoFinnishFrenchFrench American IndianFrench CanadianGermanGerman RussianGhanaianGreekGuamanian/ChamorroGuatemalanGuyaneseHaitianHmongHonduranHopiHoumaHungarianIcelanderIndian (Asian)IndonesianInupiatIranianIraqiIrishIroquoisIsraeliItalianJamaicanJapaneseJordanianKenyanKiowaKoreanLatvianLebaneseLiberianLithuanianLumbeeLuxembourgerMacedonianMalaysianMalteseMarshalleseMenomineeMexicanMexican American IndianMongolianMoroccanNative HawaiianNavajoNepaleseNew ZealanderNicaraguanNigerianNorthern EuropeanNorwegianOkinawanOsageOttawaPaiutePakistaniPalestinianPanamanianParaguayanPennsylvania GermanPeruvianPimaPolishPortuguesePotawatomiPuebloPuerto RicanPuget Sound SalishRomanianRussianSalvadoranSamoanScandinavianScotch-IrishScottishSeminoleSenegaleseSerbianShoshoneSierra LeoneanSiouxSlavicSlovakSloveneSomaliSouth AfricanSouth AmericanSouth American IndianSoviet UnionSpaniardSpanishSpanish AmericanSpanish American IndianSri LankanSubsaharan AfricanSudaneseSwedishSwissSyrianTaiwaneseThaiTlingit-HaidaTohono O'OdhamTonganTrinidadian and TobagonianTsimshianTurkishU.S. Virgin IslanderUgandanUkrainianUruguayanUteVenezuelanVietnameseWelshWest IndianYakamaYaquiYugoslavianYumanYup'ikZimbabwean
Immigration
NonimmigrantsImmigrantsAfghanistanAfricaAlbaniaArgentinaArmeniaAsiaAustraliaAustriaBahamasBangladeshBarbadosBelarusBelgiumBelizeBoliviaBosnia and HerzegovinaBrazilBulgariaBurma/MyanmarCabo VerdeCambodiaCameroonCanadaCaribbeanCentral AmericaChileChinaColombiaCongoCosta RicaCroatiaCubaCzechoslovakiaDenmarkDominicaDominican RepublicEastern AfricaEastern AsiaEastern EuropeEcuadorEgyptEl SalvadorEnglandEritreaEthiopiaEuropeFijiFranceGermanyGhanaGreeceGrenadaGuatemalaGuyanaHaitiHondurasHong KongHungaryIndiaIndonesiaIranIraqIrelandIsraelItalyJamaicaJapanJordanKazakhstanKenyaKoreaKuwaitLaosLatin AmericaLatviaLebanonLiberiaLithuaniaMalaysiaMexicoMicronesiaMiddle AfricaMoldovaMoroccoNepalNetherlandsNicaraguaNigeriaNorth AmericaNorth MacedoniaNorthern AfricaNorthern EuropeNorwayOceaniaPakistanPanamaPeruPhilippinesPolandPortugalRomaniaRussiaSaudi ArabiaScotlandSenegalSerbiaSierra LeoneSingaporeSomaliaSouth AfricaSouth AmericaSouth Central AsiaSouth Eastern AsiaSouthern EuropeSpainSri LankaSt. Vincent and the GrenadinesSudanSwedenSwitzerlandSyriaTaiwanThailandTrinidad and TobagoTurkeyUgandaUkraineUruguayUzbekistanVenezuelaVietnamWest IndiesWestern AfricaWestern AsiaWestern EuropeYemenZaireZimbabweAzores
Laotian
Race
Ancestry
AfghanAfricanAlaska NativeAlaskan AthabascanAlbanianAleutAlsatianAmericanApacheArabArapahoArgentineanArmenianAssyrian/Chaldean/SyriacAustralianAustrianBahamianBangladeshiBarbadianBasqueBelgianBelizeanBermudanBhutaneseBlackfeetBolivianBritishBritish West IndianBulgarianBurmeseCajunCambodianCanadianCape VerdeanCarpatho RusynCelticCentral AmericanCentral American IndianCherokeeCheyenneChickasawChileanChineseChippewaChoctawColombianColvilleComancheCosta RicanCreeCreekCroatianCrowCubanCypriotCzechCzechoslovakianDanishDelawareDominicanDutchDutch West IndianEastern EuropeanEcuadorianEgyptianEnglishEstonianEthiopianEuropeanFijianFilipinoFinnishFrenchFrench American IndianFrench CanadianGermanGerman RussianGhanaianGreekGuamanian/ChamorroGuatemalanGuyaneseHaitianHmongHonduranHopiHoumaHungarianIcelanderIndian (Asian)IndonesianInupiatIranianIraqiIrishIroquoisIsraeliItalianJamaicanJapaneseJordanianKenyanKiowaKoreanLaotianLatvianLebaneseLiberianLithuanianLumbeeLuxembourgerMacedonianMalaysianMalteseMarshalleseMenomineeMexicanMexican American IndianMongolianMoroccanNative HawaiianNavajoNepaleseNew ZealanderNicaraguanNigerianNorthern EuropeanNorwegianOkinawanOsageOttawaPaiutePakistaniPalestinianPanamanianParaguayanPennsylvania GermanPeruvianPimaPolishPortuguesePotawatomiPuebloPuerto RicanPuget Sound SalishRomanianRussianSalvadoranSamoanScandinavianScotch-IrishScottishSeminoleSenegaleseSerbianShoshoneSierra LeoneanSiouxSlavicSlovakSloveneSomaliSouth AfricanSouth AmericanSouth American IndianSoviet UnionSpaniardSpanishSpanish AmericanSpanish American IndianSri LankanSubsaharan AfricanSudaneseSwedishSwissSyrianTaiwaneseThaiTlingit-HaidaTohono O'OdhamTonganTrinidadian and TobagonianTsimshianTurkishU.S. Virgin IslanderUgandanUkrainianUruguayanUteVenezuelanVietnameseWelshWest IndianYakamaYaquiYugoslavianYumanYup'ikZimbabwean
Immigration
NonimmigrantsImmigrantsAfghanistanAfricaAlbaniaArgentinaArmeniaAsiaAustraliaAustriaBahamasBangladeshBarbadosBelarusBelgiumBelizeBoliviaBosnia and HerzegovinaBrazilBulgariaBurma/MyanmarCabo VerdeCambodiaCameroonCanadaCaribbeanCentral AmericaChileChinaColombiaCongoCosta RicaCroatiaCubaCzechoslovakiaDenmarkDominicaDominican RepublicEastern AfricaEastern AsiaEastern EuropeEcuadorEgyptEl SalvadorEnglandEritreaEthiopiaEuropeFijiFranceGermanyGhanaGreeceGrenadaGuatemalaGuyanaHaitiHondurasHong KongHungaryIndiaIndonesiaIranIraqIrelandIsraelItalyJamaicaJapanJordanKazakhstanKenyaKoreaKuwaitLaosLatin AmericaLatviaLebanonLiberiaLithuaniaMalaysiaMexicoMicronesiaMiddle AfricaMoldovaMoroccoNepalNetherlandsNicaraguaNigeriaNorth AmericaNorth MacedoniaNorthern AfricaNorthern EuropeNorwayOceaniaPakistanPanamaPeruPhilippinesPolandPortugalRomaniaRussiaSaudi ArabiaScotlandSenegalSerbiaSierra LeoneSingaporeSomaliaSouth AfricaSouth AmericaSouth Central AsiaSouth Eastern AsiaSouthern EuropeSpainSri LankaSt. Vincent and the GrenadinesSudanSwedenSwitzerlandSyriaTaiwanThailandTrinidad and TobagoTurkeyUgandaUkraineUruguayUzbekistanVenezuelaVietnamWest IndiesWestern AfricaWestern AsiaWestern EuropeYemenZaireZimbabweAzores
Unemployment
Income
Poverty
Unemployment
Labor Participation
Family Structure
Vehicle Availability
Education Level
Disability

Unemployment Comparison

Brazilians

Laotians

Average
Good
5.3%
UNEMPLOYMENT
40.2/ 100
METRIC RATING
183rd/ 347
METRIC RANK
5.2%
UNEMPLOYMENT
66.3/ 100
METRIC RATING
160th/ 347
METRIC RANK

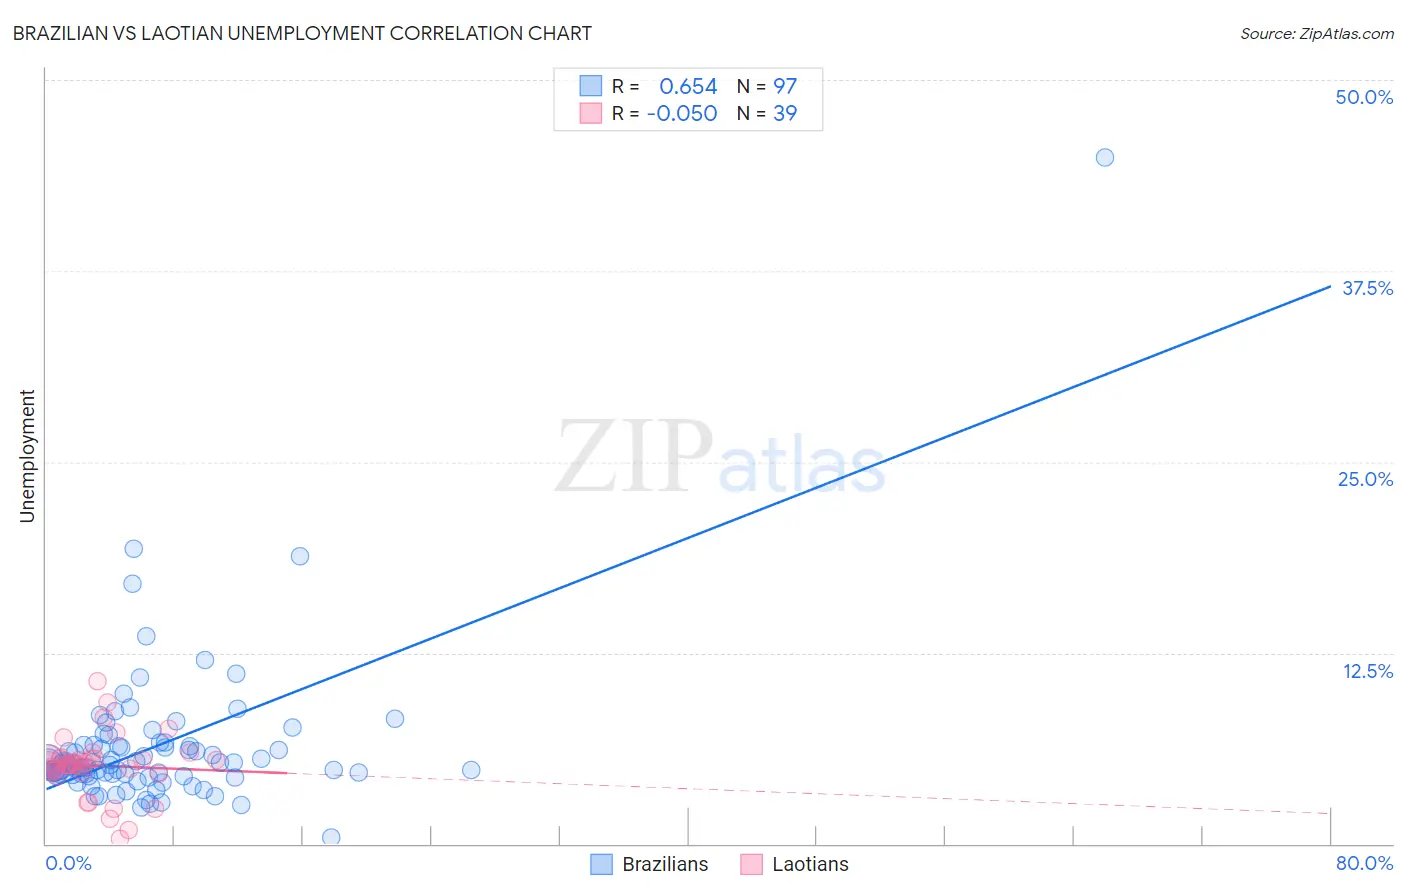
Brazilian vs Laotian Unemployment Correlation Chart

The statistical analysis conducted on geographies consisting of 323,781,873 people shows a significant positive correlation between the proportion of Brazilians and unemployment in the United States with a correlation coefficient (R) of 0.654 and weighted average of 5.3%. Similarly, the statistical analysis conducted on geographies consisting of 224,771,709 people shows a slight negative correlation between the proportion of Laotians and unemployment in the United States with a correlation coefficient (R) of -0.050 and weighted average of 5.2%, a difference of 1.7%.
Brazilian vs Laotian Unemployment

Unemployment Correlation Summary

MeasurementBrazilianLaotian
Minimum0.40%0.30%
Maximum44.9%10.6%
Range44.5%10.3%
Mean6.3%5.1%
Median5.2%5.3%
Interquartile 25% (IQ1)4.5%4.7%
Interquartile 75% (IQ3)6.4%5.6%
Interquartile Range (IQR)1.9%0.94%
Standard Deviation (Sample)5.0%2.0%
Standard Deviation (Population)5.0%2.0%

Similar Demographics by Unemployment

Demographics Similar to Brazilians by Unemployment

In terms of unemployment, the demographic groups most similar to Brazilians are Assyrian/Chaldean/Syriac (5.3%, a difference of 0.060%), Immigrants from Thailand (5.3%, a difference of 0.080%), Spaniard (5.3%, a difference of 0.13%), Immigrants from Uganda (5.3%, a difference of 0.15%), and Costa Rican (5.3%, a difference of 0.18%).
DemographicsRating | RankUnemployment
Nicaraguans
48.7
/100
|
#176
Average
5.3%
Immigrants | Nonimmigrants
47.9
/100
|
#177
Average
5.3%
Afghans
47.4
/100
|
#178
Average
5.3%
Malaysians
46.8
/100
|
#179
Average
5.3%
Immigrants | Greece
45.0
/100
|
#180
Average
5.3%
Albanians
43.5
/100
|
#181
Average
5.3%
Spaniards
42.2
/100
|
#182
Average
5.3%
Brazilians
40.2
/100
|
#183
Average
5.3%
Assyrians/Chaldeans/Syriacs
39.2
/100
|
#184
Fair
5.3%
Immigrants | Thailand
38.9
/100
|
#185
Fair
5.3%
Immigrants | Uganda
37.8
/100
|
#186
Fair
5.3%
Costa Ricans
37.4
/100
|
#187
Fair
5.3%
Alsatians
37.0
/100
|
#188
Fair
5.3%
Immigrants | Belarus
35.6
/100
|
#189
Fair
5.3%
Arabs
35.3
/100
|
#190
Fair
5.3%

Demographics Similar to Laotians by Unemployment

In terms of unemployment, the demographic groups most similar to Laotians are Immigrants from Egypt (5.2%, a difference of 0.020%), Immigrants from Russia (5.2%, a difference of 0.020%), Immigrants from Oceania (5.2%, a difference of 0.080%), Spanish (5.2%, a difference of 0.090%), and Immigrants from Zaire (5.2%, a difference of 0.11%).
DemographicsRating | RankUnemployment
Egyptians
75.2
/100
|
#153
Good
5.2%
Immigrants | China
74.7
/100
|
#154
Good
5.2%
Immigrants | Northern Africa
71.3
/100
|
#155
Good
5.2%
Immigrants | Kazakhstan
70.4
/100
|
#156
Good
5.2%
Sri Lankans
69.5
/100
|
#157
Good
5.2%
Immigrants | Egypt
66.7
/100
|
#158
Good
5.2%
Immigrants | Russia
66.6
/100
|
#159
Good
5.2%
Laotians
66.3
/100
|
#160
Good
5.2%
Immigrants | Oceania
65.2
/100
|
#161
Good
5.2%
Spanish
65.1
/100
|
#162
Good
5.2%
Immigrants | Zaire
64.7
/100
|
#163
Good
5.2%
Immigrants | Colombia
64.7
/100
|
#164
Good
5.2%
Immigrants | Brazil
63.1
/100
|
#165
Good
5.2%
Immigrants | Indonesia
61.2
/100
|
#166
Good
5.2%
Colombians
61.1
/100
|
#167
Good
5.2%