Czech vs Honduran Unemployment
COMPARE
Czech
Honduran
Unemployment
Unemployment Comparison
Czechs
Hondurans
4.3%
UNEMPLOYMENT
100.0/ 100
METRIC RATING
3rd/ 347
METRIC RANK
5.7%
UNEMPLOYMENT
0.3/ 100
METRIC RATING
252nd/ 347
METRIC RANK
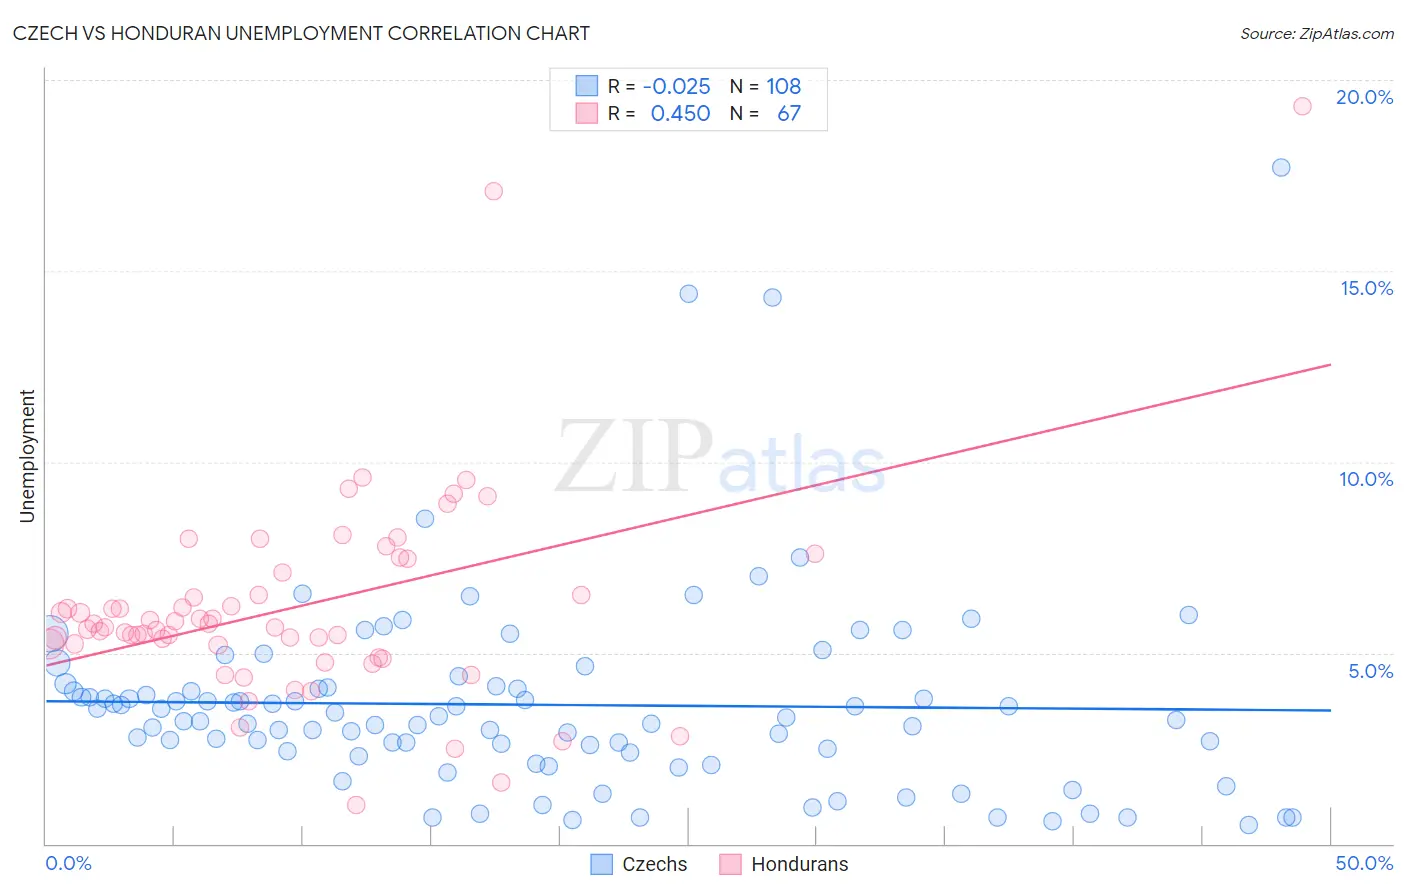
Czech vs Honduran Unemployment Correlation Chart
The statistical analysis conducted on geographies consisting of 483,205,861 people shows no correlation between the proportion of Czechs and unemployment in the United States with a correlation coefficient (R) of -0.025 and weighted average of 4.3%. Similarly, the statistical analysis conducted on geographies consisting of 357,563,016 people shows a moderate positive correlation between the proportion of Hondurans and unemployment in the United States with a correlation coefficient (R) of 0.450 and weighted average of 5.7%, a difference of 31.7%.
Unemployment Correlation Summary
| Measurement | Czech | Honduran |
| Minimum | 0.50% | 1.0% |
| Maximum | 17.7% | 19.3% |
| Range | 17.2% | 18.3% |
| Mean | 3.6% | 6.2% |
| Median | 3.3% | 5.7% |
| Interquartile 25% (IQ1) | 2.4% | 5.2% |
| Interquartile 75% (IQ3) | 4.1% | 7.1% |
| Interquartile Range (IQR) | 1.7% | 1.9% |
| Standard Deviation (Sample) | 2.6% | 2.8% |
| Standard Deviation (Population) | 2.6% | 2.8% |
Similar Demographics by Unemployment
Demographics Similar to Czechs by Unemployment
In terms of unemployment, the demographic groups most similar to Czechs are Luxembourger (4.3%, a difference of 0.10%), Danish (4.3%, a difference of 0.15%), Swedish (4.4%, a difference of 2.5%), German (4.5%, a difference of 3.3%), and Norwegian (4.2%, a difference of 3.5%).
| Demographics | Rating | Rank | Unemployment |
| Norwegians | 100.0 /100 | #1 | Exceptional 4.2% |
| Luxembourgers | 100.0 /100 | #2 | Exceptional 4.3% |
| Czechs | 100.0 /100 | #3 | Exceptional 4.3% |
| Danes | 100.0 /100 | #4 | Exceptional 4.3% |
| Swedes | 100.0 /100 | #5 | Exceptional 4.4% |
| Germans | 100.0 /100 | #6 | Exceptional 4.5% |
| Immigrants | India | 100.0 /100 | #7 | Exceptional 4.5% |
| Swiss | 100.0 /100 | #8 | Exceptional 4.5% |
| Scandinavians | 100.0 /100 | #9 | Exceptional 4.5% |
| Dutch | 100.0 /100 | #10 | Exceptional 4.6% |
| English | 100.0 /100 | #11 | Exceptional 4.6% |
| Pennsylvania Germans | 100.0 /100 | #12 | Exceptional 4.6% |
| Belgians | 100.0 /100 | #13 | Exceptional 4.6% |
| Immigrants | Cuba | 100.0 /100 | #14 | Exceptional 4.6% |
| Europeans | 99.9 /100 | #15 | Exceptional 4.6% |
Demographics Similar to Hondurans by Unemployment
In terms of unemployment, the demographic groups most similar to Hondurans are Central American (5.7%, a difference of 0.010%), Immigrants from Honduras (5.7%, a difference of 0.080%), Immigrants from Portugal (5.7%, a difference of 0.53%), Kiowa (5.7%, a difference of 0.74%), and Guatemalan (5.8%, a difference of 0.74%).
| Demographics | Rating | Rank | Unemployment |
| French American Indians | 1.2 /100 | #245 | Tragic 5.6% |
| Bermudans | 1.1 /100 | #246 | Tragic 5.6% |
| Immigrants | Cameroon | 1.0 /100 | #247 | Tragic 5.6% |
| Liberians | 0.9 /100 | #248 | Tragic 5.6% |
| Cajuns | 0.8 /100 | #249 | Tragic 5.6% |
| Japanese | 0.8 /100 | #250 | Tragic 5.6% |
| Kiowa | 0.6 /100 | #251 | Tragic 5.7% |
| Hondurans | 0.3 /100 | #252 | Tragic 5.7% |
| Central Americans | 0.3 /100 | #253 | Tragic 5.7% |
| Immigrants | Honduras | 0.3 /100 | #254 | Tragic 5.7% |
| Immigrants | Portugal | 0.2 /100 | #255 | Tragic 5.7% |
| Guatemalans | 0.2 /100 | #256 | Tragic 5.8% |
| Yaqui | 0.2 /100 | #257 | Tragic 5.8% |
| Immigrants | Bahamas | 0.1 /100 | #258 | Tragic 5.8% |
| Sub-Saharan Africans | 0.1 /100 | #259 | Tragic 5.8% |