Czech vs Albanian Unemployment
COMPARE
Czech
Albanian
Unemployment
Unemployment Comparison
Czechs
Albanians
4.3%
UNEMPLOYMENT
100.0/ 100
METRIC RATING
3rd/ 347
METRIC RANK
5.3%
UNEMPLOYMENT
43.5/ 100
METRIC RATING
181st/ 347
METRIC RANK
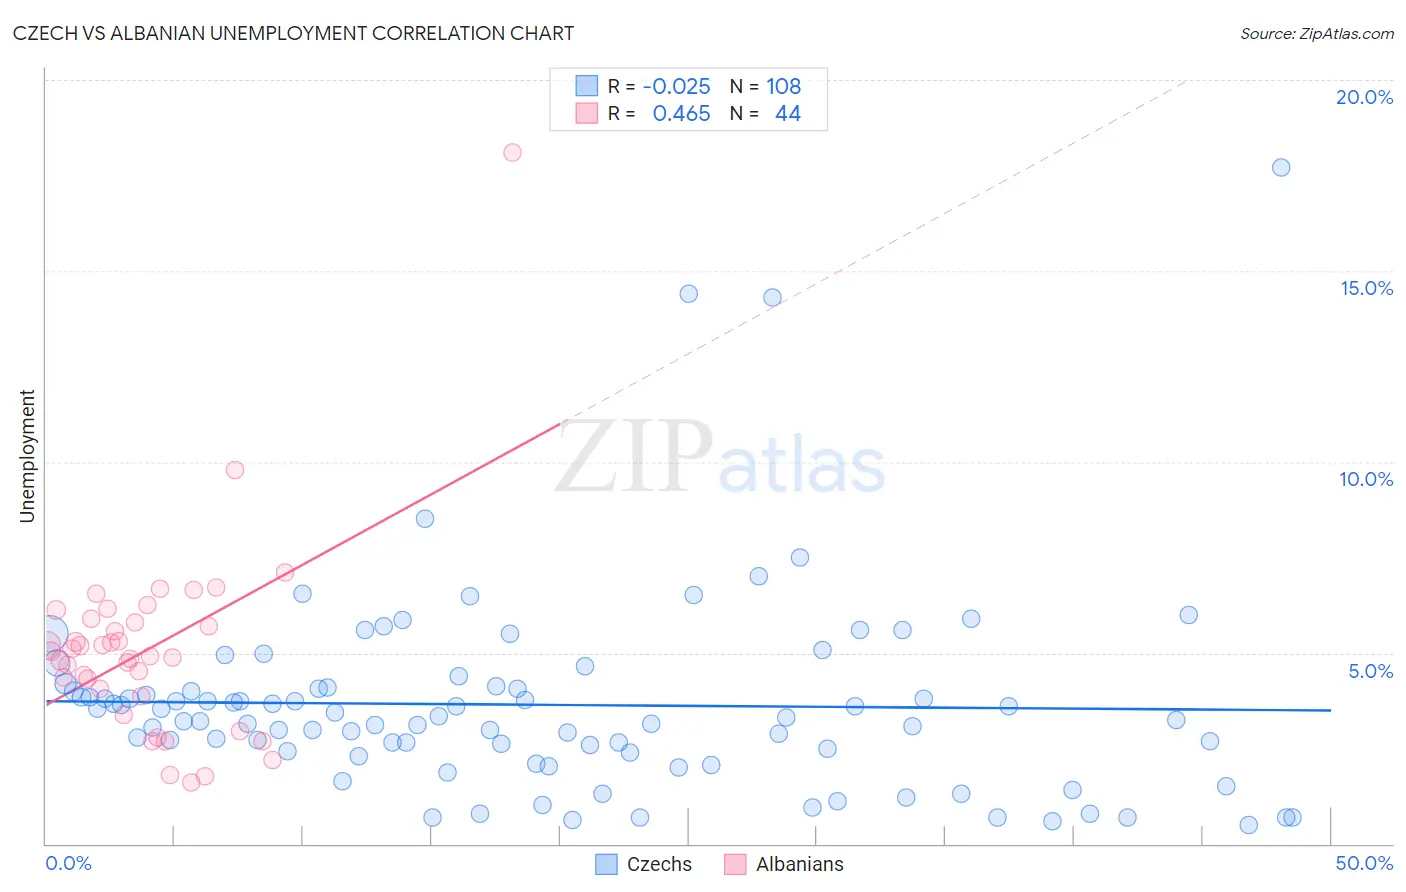
Czech vs Albanian Unemployment Correlation Chart
The statistical analysis conducted on geographies consisting of 483,205,861 people shows no correlation between the proportion of Czechs and unemployment in the United States with a correlation coefficient (R) of -0.025 and weighted average of 4.3%. Similarly, the statistical analysis conducted on geographies consisting of 193,192,557 people shows a moderate positive correlation between the proportion of Albanians and unemployment in the United States with a correlation coefficient (R) of 0.465 and weighted average of 5.3%, a difference of 21.6%.
Unemployment Correlation Summary
| Measurement | Czech | Albanian |
| Minimum | 0.50% | 1.6% |
| Maximum | 17.7% | 18.1% |
| Range | 17.2% | 16.5% |
| Mean | 3.6% | 5.1% |
| Median | 3.3% | 5.0% |
| Interquartile 25% (IQ1) | 2.4% | 3.9% |
| Interquartile 75% (IQ3) | 4.1% | 5.8% |
| Interquartile Range (IQR) | 1.7% | 1.9% |
| Standard Deviation (Sample) | 2.6% | 2.6% |
| Standard Deviation (Population) | 2.6% | 2.6% |
Similar Demographics by Unemployment
Demographics Similar to Czechs by Unemployment
In terms of unemployment, the demographic groups most similar to Czechs are Luxembourger (4.3%, a difference of 0.10%), Danish (4.3%, a difference of 0.15%), Swedish (4.4%, a difference of 2.5%), German (4.5%, a difference of 3.3%), and Norwegian (4.2%, a difference of 3.5%).
| Demographics | Rating | Rank | Unemployment |
| Norwegians | 100.0 /100 | #1 | Exceptional 4.2% |
| Luxembourgers | 100.0 /100 | #2 | Exceptional 4.3% |
| Czechs | 100.0 /100 | #3 | Exceptional 4.3% |
| Danes | 100.0 /100 | #4 | Exceptional 4.3% |
| Swedes | 100.0 /100 | #5 | Exceptional 4.4% |
| Germans | 100.0 /100 | #6 | Exceptional 4.5% |
| Immigrants | India | 100.0 /100 | #7 | Exceptional 4.5% |
| Swiss | 100.0 /100 | #8 | Exceptional 4.5% |
| Scandinavians | 100.0 /100 | #9 | Exceptional 4.5% |
| Dutch | 100.0 /100 | #10 | Exceptional 4.6% |
| English | 100.0 /100 | #11 | Exceptional 4.6% |
| Pennsylvania Germans | 100.0 /100 | #12 | Exceptional 4.6% |
| Belgians | 100.0 /100 | #13 | Exceptional 4.6% |
| Immigrants | Cuba | 100.0 /100 | #14 | Exceptional 4.6% |
| Europeans | 99.9 /100 | #15 | Exceptional 4.6% |
Demographics Similar to Albanians by Unemployment
In terms of unemployment, the demographic groups most similar to Albanians are Spaniard (5.3%, a difference of 0.080%), Immigrants from Greece (5.3%, a difference of 0.090%), Malaysian (5.3%, a difference of 0.21%), Brazilian (5.3%, a difference of 0.21%), and Afghan (5.3%, a difference of 0.24%).
| Demographics | Rating | Rank | Unemployment |
| Immigrants | Congo | 50.0 /100 | #174 | Average 5.3% |
| Taiwanese | 49.6 /100 | #175 | Average 5.3% |
| Nicaraguans | 48.7 /100 | #176 | Average 5.3% |
| Immigrants | Nonimmigrants | 47.9 /100 | #177 | Average 5.3% |
| Afghans | 47.4 /100 | #178 | Average 5.3% |
| Malaysians | 46.8 /100 | #179 | Average 5.3% |
| Immigrants | Greece | 45.0 /100 | #180 | Average 5.3% |
| Albanians | 43.5 /100 | #181 | Average 5.3% |
| Spaniards | 42.2 /100 | #182 | Average 5.3% |
| Brazilians | 40.2 /100 | #183 | Average 5.3% |
| Assyrians/Chaldeans/Syriacs | 39.2 /100 | #184 | Fair 5.3% |
| Immigrants | Thailand | 38.9 /100 | #185 | Fair 5.3% |
| Immigrants | Uganda | 37.8 /100 | #186 | Fair 5.3% |
| Costa Ricans | 37.4 /100 | #187 | Fair 5.3% |
| Alsatians | 37.0 /100 | #188 | Fair 5.3% |