Czech vs Immigrants from Ireland Unemployment
COMPARE
Czech
Immigrants from Ireland
Unemployment
Unemployment Comparison
Czechs
Immigrants from Ireland
4.3%
UNEMPLOYMENT
100.0/ 100
METRIC RATING
3rd/ 347
METRIC RANK
5.1%
UNEMPLOYMENT
92.1/ 100
METRIC RATING
114th/ 347
METRIC RANK
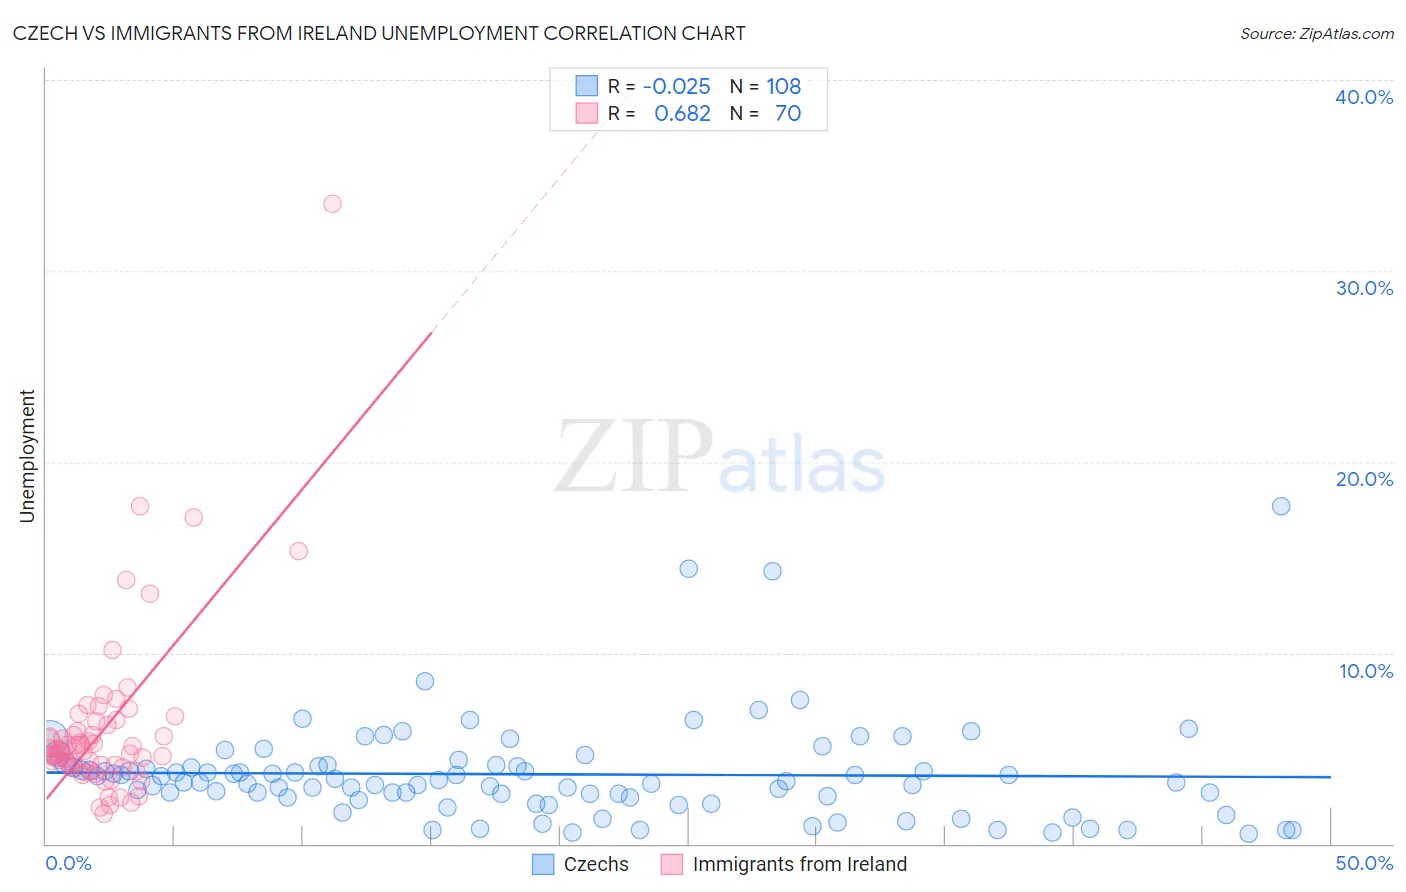
Czech vs Immigrants from Ireland Unemployment Correlation Chart
The statistical analysis conducted on geographies consisting of 483,205,861 people shows no correlation between the proportion of Czechs and unemployment in the United States with a correlation coefficient (R) of -0.025 and weighted average of 4.3%. Similarly, the statistical analysis conducted on geographies consisting of 240,659,680 people shows a significant positive correlation between the proportion of Immigrants from Ireland and unemployment in the United States with a correlation coefficient (R) of 0.682 and weighted average of 5.1%, a difference of 16.5%.
Unemployment Correlation Summary
| Measurement | Czech | Immigrants from Ireland |
| Minimum | 0.50% | 1.6% |
| Maximum | 17.7% | 33.5% |
| Range | 17.2% | 31.9% |
| Mean | 3.6% | 6.0% |
| Median | 3.3% | 4.9% |
| Interquartile 25% (IQ1) | 2.4% | 4.1% |
| Interquartile 75% (IQ3) | 4.1% | 6.2% |
| Interquartile Range (IQR) | 1.7% | 2.1% |
| Standard Deviation (Sample) | 2.6% | 4.6% |
| Standard Deviation (Population) | 2.6% | 4.6% |
Similar Demographics by Unemployment
Demographics Similar to Czechs by Unemployment
In terms of unemployment, the demographic groups most similar to Czechs are Luxembourger (4.3%, a difference of 0.10%), Danish (4.3%, a difference of 0.15%), Swedish (4.4%, a difference of 2.5%), German (4.5%, a difference of 3.3%), and Norwegian (4.2%, a difference of 3.5%).
| Demographics | Rating | Rank | Unemployment |
| Norwegians | 100.0 /100 | #1 | Exceptional 4.2% |
| Luxembourgers | 100.0 /100 | #2 | Exceptional 4.3% |
| Czechs | 100.0 /100 | #3 | Exceptional 4.3% |
| Danes | 100.0 /100 | #4 | Exceptional 4.3% |
| Swedes | 100.0 /100 | #5 | Exceptional 4.4% |
| Germans | 100.0 /100 | #6 | Exceptional 4.5% |
| Immigrants | India | 100.0 /100 | #7 | Exceptional 4.5% |
| Swiss | 100.0 /100 | #8 | Exceptional 4.5% |
| Scandinavians | 100.0 /100 | #9 | Exceptional 4.5% |
| Dutch | 100.0 /100 | #10 | Exceptional 4.6% |
| English | 100.0 /100 | #11 | Exceptional 4.6% |
| Pennsylvania Germans | 100.0 /100 | #12 | Exceptional 4.6% |
| Belgians | 100.0 /100 | #13 | Exceptional 4.6% |
| Immigrants | Cuba | 100.0 /100 | #14 | Exceptional 4.6% |
| Europeans | 99.9 /100 | #15 | Exceptional 4.6% |
Demographics Similar to Immigrants from Ireland by Unemployment
In terms of unemployment, the demographic groups most similar to Immigrants from Ireland are Argentinean (5.1%, a difference of 0.060%), South African (5.1%, a difference of 0.10%), Immigrants from Western Europe (5.1%, a difference of 0.21%), Immigrants from Sri Lanka (5.1%, a difference of 0.22%), and Immigrants from Malaysia (5.1%, a difference of 0.24%).
| Demographics | Rating | Rank | Unemployment |
| Immigrants | Turkey | 93.7 /100 | #107 | Exceptional 5.0% |
| Immigrants | Kuwait | 93.7 /100 | #108 | Exceptional 5.0% |
| Immigrants | Eritrea | 93.3 /100 | #109 | Exceptional 5.0% |
| Immigrants | Lithuania | 93.2 /100 | #110 | Exceptional 5.0% |
| Chileans | 93.2 /100 | #111 | Exceptional 5.0% |
| South Africans | 92.6 /100 | #112 | Exceptional 5.1% |
| Argentineans | 92.4 /100 | #113 | Exceptional 5.1% |
| Immigrants | Ireland | 92.1 /100 | #114 | Exceptional 5.1% |
| Immigrants | Western Europe | 91.1 /100 | #115 | Exceptional 5.1% |
| Immigrants | Sri Lanka | 91.1 /100 | #116 | Exceptional 5.1% |
| Immigrants | Malaysia | 91.0 /100 | #117 | Exceptional 5.1% |
| Immigrants | Germany | 90.8 /100 | #118 | Exceptional 5.1% |
| Immigrants | France | 89.7 /100 | #119 | Excellent 5.1% |
| Macedonians | 89.7 /100 | #120 | Excellent 5.1% |
| Lebanese | 89.2 /100 | #121 | Excellent 5.1% |