Czech vs Taiwanese Unemployment
COMPARE
Czech
Taiwanese
Unemployment
Unemployment Comparison
Czechs
Taiwanese
4.3%
UNEMPLOYMENT
100.0/ 100
METRIC RATING
3rd/ 347
METRIC RANK
5.3%
UNEMPLOYMENT
49.6/ 100
METRIC RATING
175th/ 347
METRIC RANK
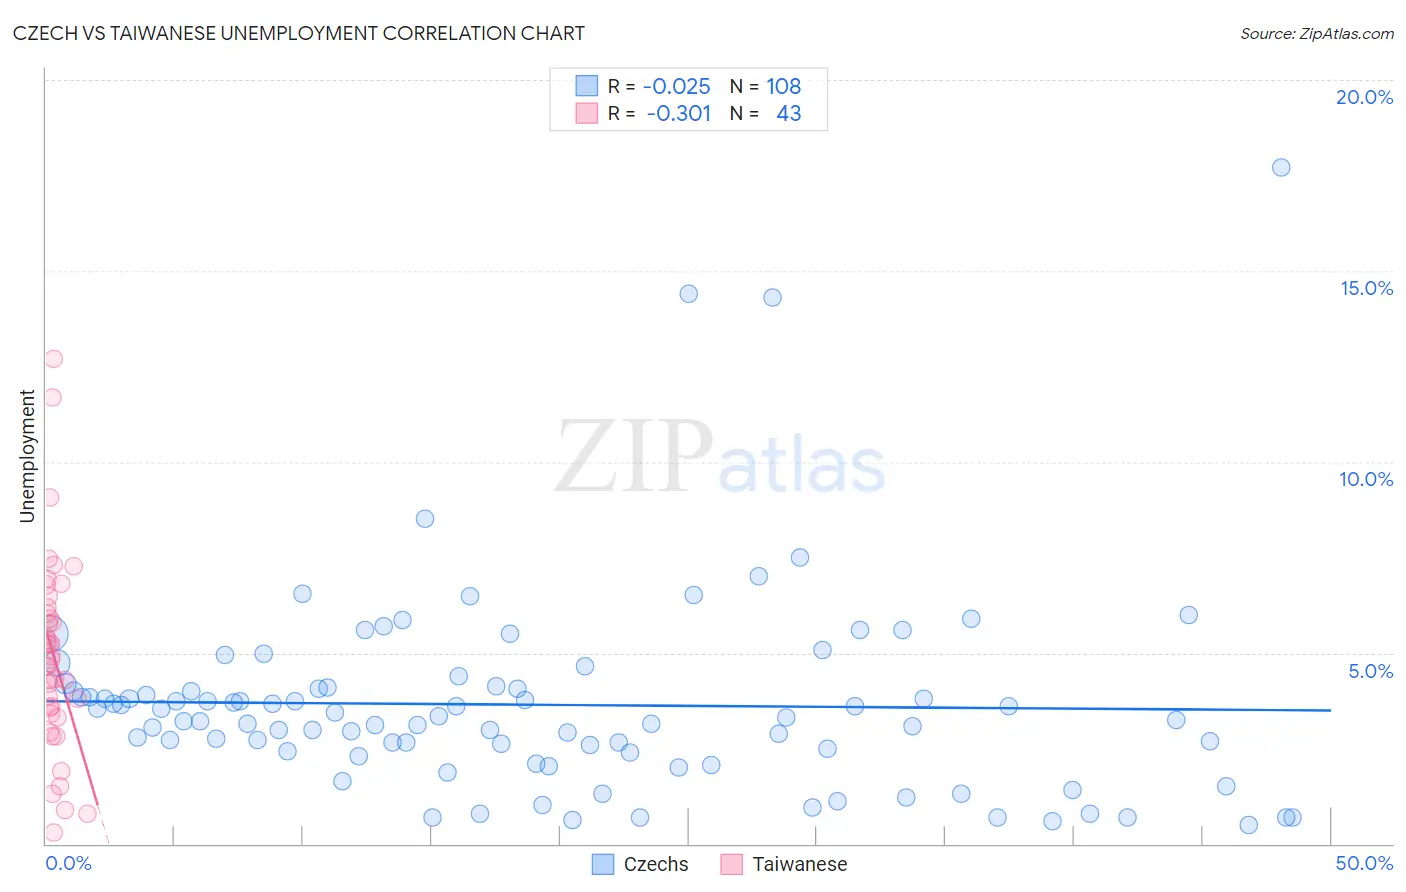
Czech vs Taiwanese Unemployment Correlation Chart
The statistical analysis conducted on geographies consisting of 483,205,861 people shows no correlation between the proportion of Czechs and unemployment in the United States with a correlation coefficient (R) of -0.025 and weighted average of 4.3%. Similarly, the statistical analysis conducted on geographies consisting of 31,724,466 people shows a mild negative correlation between the proportion of Taiwanese and unemployment in the United States with a correlation coefficient (R) of -0.301 and weighted average of 5.3%, a difference of 21.1%.
Unemployment Correlation Summary
| Measurement | Czech | Taiwanese |
| Minimum | 0.50% | 0.30% |
| Maximum | 17.7% | 12.7% |
| Range | 17.2% | 12.4% |
| Mean | 3.6% | 4.9% |
| Median | 3.3% | 4.8% |
| Interquartile 25% (IQ1) | 2.4% | 3.4% |
| Interquartile 75% (IQ3) | 4.1% | 6.2% |
| Interquartile Range (IQR) | 1.7% | 2.8% |
| Standard Deviation (Sample) | 2.6% | 2.6% |
| Standard Deviation (Population) | 2.6% | 2.5% |
Similar Demographics by Unemployment
Demographics Similar to Czechs by Unemployment
In terms of unemployment, the demographic groups most similar to Czechs are Luxembourger (4.3%, a difference of 0.10%), Danish (4.3%, a difference of 0.15%), Swedish (4.4%, a difference of 2.5%), German (4.5%, a difference of 3.3%), and Norwegian (4.2%, a difference of 3.5%).
| Demographics | Rating | Rank | Unemployment |
| Norwegians | 100.0 /100 | #1 | Exceptional 4.2% |
| Luxembourgers | 100.0 /100 | #2 | Exceptional 4.3% |
| Czechs | 100.0 /100 | #3 | Exceptional 4.3% |
| Danes | 100.0 /100 | #4 | Exceptional 4.3% |
| Swedes | 100.0 /100 | #5 | Exceptional 4.4% |
| Germans | 100.0 /100 | #6 | Exceptional 4.5% |
| Immigrants | India | 100.0 /100 | #7 | Exceptional 4.5% |
| Swiss | 100.0 /100 | #8 | Exceptional 4.5% |
| Scandinavians | 100.0 /100 | #9 | Exceptional 4.5% |
| Dutch | 100.0 /100 | #10 | Exceptional 4.6% |
| English | 100.0 /100 | #11 | Exceptional 4.6% |
| Pennsylvania Germans | 100.0 /100 | #12 | Exceptional 4.6% |
| Belgians | 100.0 /100 | #13 | Exceptional 4.6% |
| Immigrants | Cuba | 100.0 /100 | #14 | Exceptional 4.6% |
| Europeans | 99.9 /100 | #15 | Exceptional 4.6% |
Demographics Similar to Taiwanese by Unemployment
In terms of unemployment, the demographic groups most similar to Taiwanese are Immigrants from Congo (5.3%, a difference of 0.020%), Nicaraguan (5.3%, a difference of 0.060%), Nonimmigrants (5.3%, a difference of 0.11%), Immigrants from Poland (5.3%, a difference of 0.13%), and Afghan (5.3%, a difference of 0.14%).
| Demographics | Rating | Rank | Unemployment |
| Uruguayans | 60.2 /100 | #168 | Good 5.2% |
| Immigrants | Morocco | 59.1 /100 | #169 | Average 5.2% |
| Immigrants | Nicaragua | 57.1 /100 | #170 | Average 5.2% |
| Puget Sound Salish | 56.6 /100 | #171 | Average 5.2% |
| Immigrants | Vietnam | 52.5 /100 | #172 | Average 5.2% |
| Immigrants | Poland | 51.8 /100 | #173 | Average 5.3% |
| Immigrants | Congo | 50.0 /100 | #174 | Average 5.3% |
| Taiwanese | 49.6 /100 | #175 | Average 5.3% |
| Nicaraguans | 48.7 /100 | #176 | Average 5.3% |
| Immigrants | Nonimmigrants | 47.9 /100 | #177 | Average 5.3% |
| Afghans | 47.4 /100 | #178 | Average 5.3% |
| Malaysians | 46.8 /100 | #179 | Average 5.3% |
| Immigrants | Greece | 45.0 /100 | #180 | Average 5.3% |
| Albanians | 43.5 /100 | #181 | Average 5.3% |
| Spaniards | 42.2 /100 | #182 | Average 5.3% |