Czech vs Immigrants from Liberia Unemployment
COMPARE
Czech
Immigrants from Liberia
Unemployment
Unemployment Comparison
Czechs
Immigrants from Liberia
4.3%
UNEMPLOYMENT
100.0/ 100
METRIC RATING
3rd/ 347
METRIC RANK
5.8%
UNEMPLOYMENT
0.1/ 100
METRIC RATING
264th/ 347
METRIC RANK
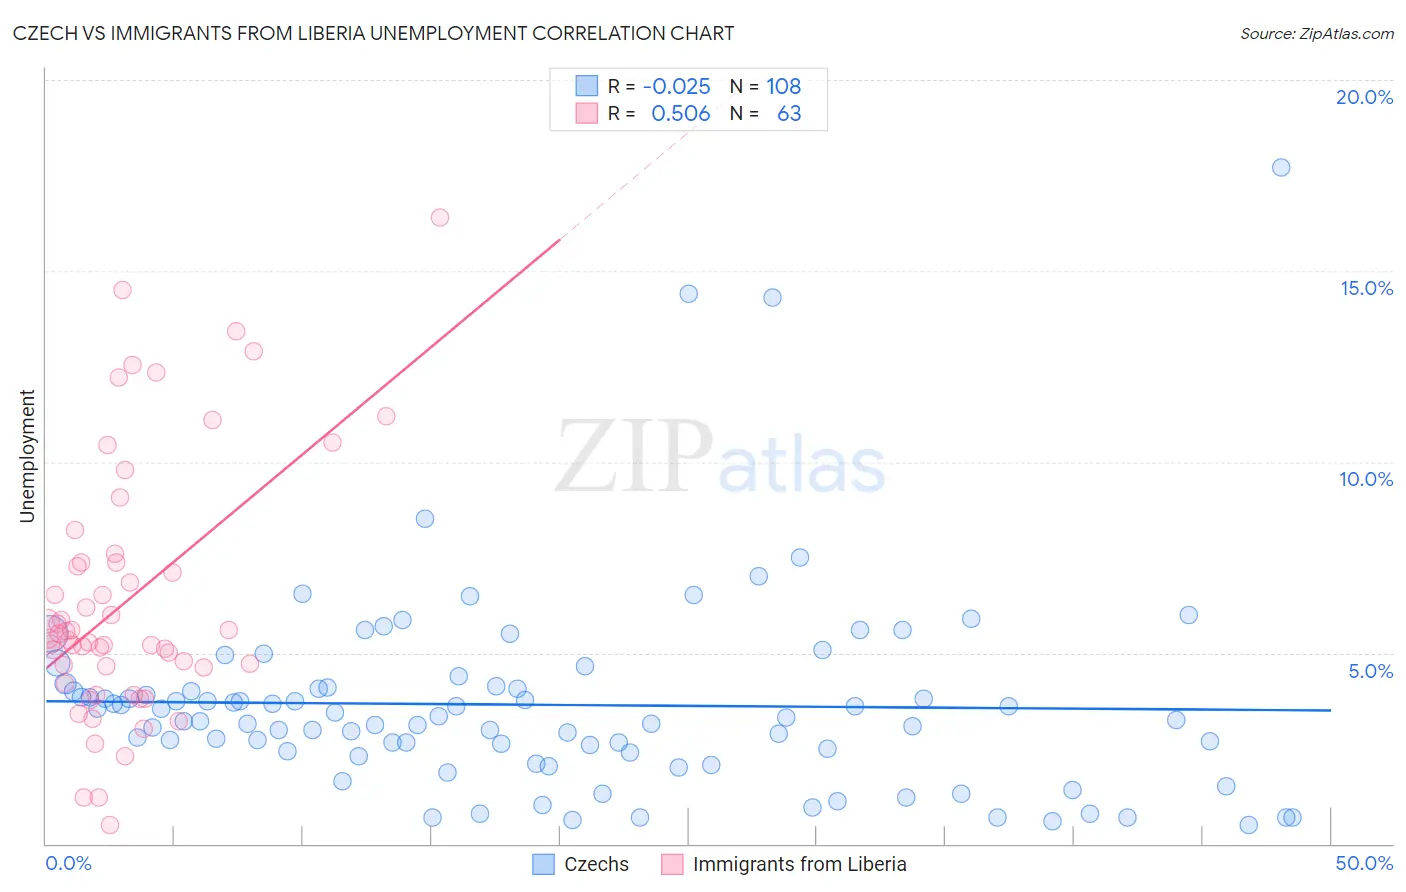
Czech vs Immigrants from Liberia Unemployment Correlation Chart
The statistical analysis conducted on geographies consisting of 483,205,861 people shows no correlation between the proportion of Czechs and unemployment in the United States with a correlation coefficient (R) of -0.025 and weighted average of 4.3%. Similarly, the statistical analysis conducted on geographies consisting of 135,254,533 people shows a substantial positive correlation between the proportion of Immigrants from Liberia and unemployment in the United States with a correlation coefficient (R) of 0.506 and weighted average of 5.8%, a difference of 33.7%.
Unemployment Correlation Summary
| Measurement | Czech | Immigrants from Liberia |
| Minimum | 0.50% | 0.50% |
| Maximum | 17.7% | 16.4% |
| Range | 17.2% | 15.9% |
| Mean | 3.6% | 6.4% |
| Median | 3.3% | 5.4% |
| Interquartile 25% (IQ1) | 2.4% | 4.6% |
| Interquartile 75% (IQ3) | 4.1% | 7.4% |
| Interquartile Range (IQR) | 1.7% | 2.8% |
| Standard Deviation (Sample) | 2.6% | 3.4% |
| Standard Deviation (Population) | 2.6% | 3.3% |
Similar Demographics by Unemployment
Demographics Similar to Czechs by Unemployment
In terms of unemployment, the demographic groups most similar to Czechs are Luxembourger (4.3%, a difference of 0.10%), Danish (4.3%, a difference of 0.15%), Swedish (4.4%, a difference of 2.5%), German (4.5%, a difference of 3.3%), and Norwegian (4.2%, a difference of 3.5%).
| Demographics | Rating | Rank | Unemployment |
| Norwegians | 100.0 /100 | #1 | Exceptional 4.2% |
| Luxembourgers | 100.0 /100 | #2 | Exceptional 4.3% |
| Czechs | 100.0 /100 | #3 | Exceptional 4.3% |
| Danes | 100.0 /100 | #4 | Exceptional 4.3% |
| Swedes | 100.0 /100 | #5 | Exceptional 4.4% |
| Germans | 100.0 /100 | #6 | Exceptional 4.5% |
| Immigrants | India | 100.0 /100 | #7 | Exceptional 4.5% |
| Swiss | 100.0 /100 | #8 | Exceptional 4.5% |
| Scandinavians | 100.0 /100 | #9 | Exceptional 4.5% |
| Dutch | 100.0 /100 | #10 | Exceptional 4.6% |
| English | 100.0 /100 | #11 | Exceptional 4.6% |
| Pennsylvania Germans | 100.0 /100 | #12 | Exceptional 4.6% |
| Belgians | 100.0 /100 | #13 | Exceptional 4.6% |
| Immigrants | Cuba | 100.0 /100 | #14 | Exceptional 4.6% |
| Europeans | 99.9 /100 | #15 | Exceptional 4.6% |
Demographics Similar to Immigrants from Liberia by Unemployment
In terms of unemployment, the demographic groups most similar to Immigrants from Liberia are Nigerian (5.8%, a difference of 0.070%), Salvadoran (5.8%, a difference of 0.090%), Sierra Leonean (5.8%, a difference of 0.13%), Immigrants from Guatemala (5.8%, a difference of 0.23%), and Immigrants from Uzbekistan (5.8%, a difference of 0.25%).
| Demographics | Rating | Rank | Unemployment |
| Yaqui | 0.2 /100 | #257 | Tragic 5.8% |
| Immigrants | Bahamas | 0.1 /100 | #258 | Tragic 5.8% |
| Sub-Saharan Africans | 0.1 /100 | #259 | Tragic 5.8% |
| Immigrants | Uzbekistan | 0.1 /100 | #260 | Tragic 5.8% |
| Immigrants | Guatemala | 0.1 /100 | #261 | Tragic 5.8% |
| Sierra Leoneans | 0.1 /100 | #262 | Tragic 5.8% |
| Salvadorans | 0.1 /100 | #263 | Tragic 5.8% |
| Immigrants | Liberia | 0.1 /100 | #264 | Tragic 5.8% |
| Nigerians | 0.1 /100 | #265 | Tragic 5.8% |
| Mexican American Indians | 0.1 /100 | #266 | Tragic 5.8% |
| Immigrants | Nigeria | 0.1 /100 | #267 | Tragic 5.8% |
| Immigrants | Sierra Leone | 0.1 /100 | #268 | Tragic 5.8% |
| Immigrants | El Salvador | 0.1 /100 | #269 | Tragic 5.8% |
| Blackfeet | 0.1 /100 | #270 | Tragic 5.8% |
| Mexicans | 0.1 /100 | #271 | Tragic 5.9% |