Zip Codes with the Highest Percentage of Population Employed in Computer, Engineering & Science in Amarillo, TX
RELATED REPORTS & OPTIONS
Computer, Engineering & Science
Amarillo
Compare Zip Codes
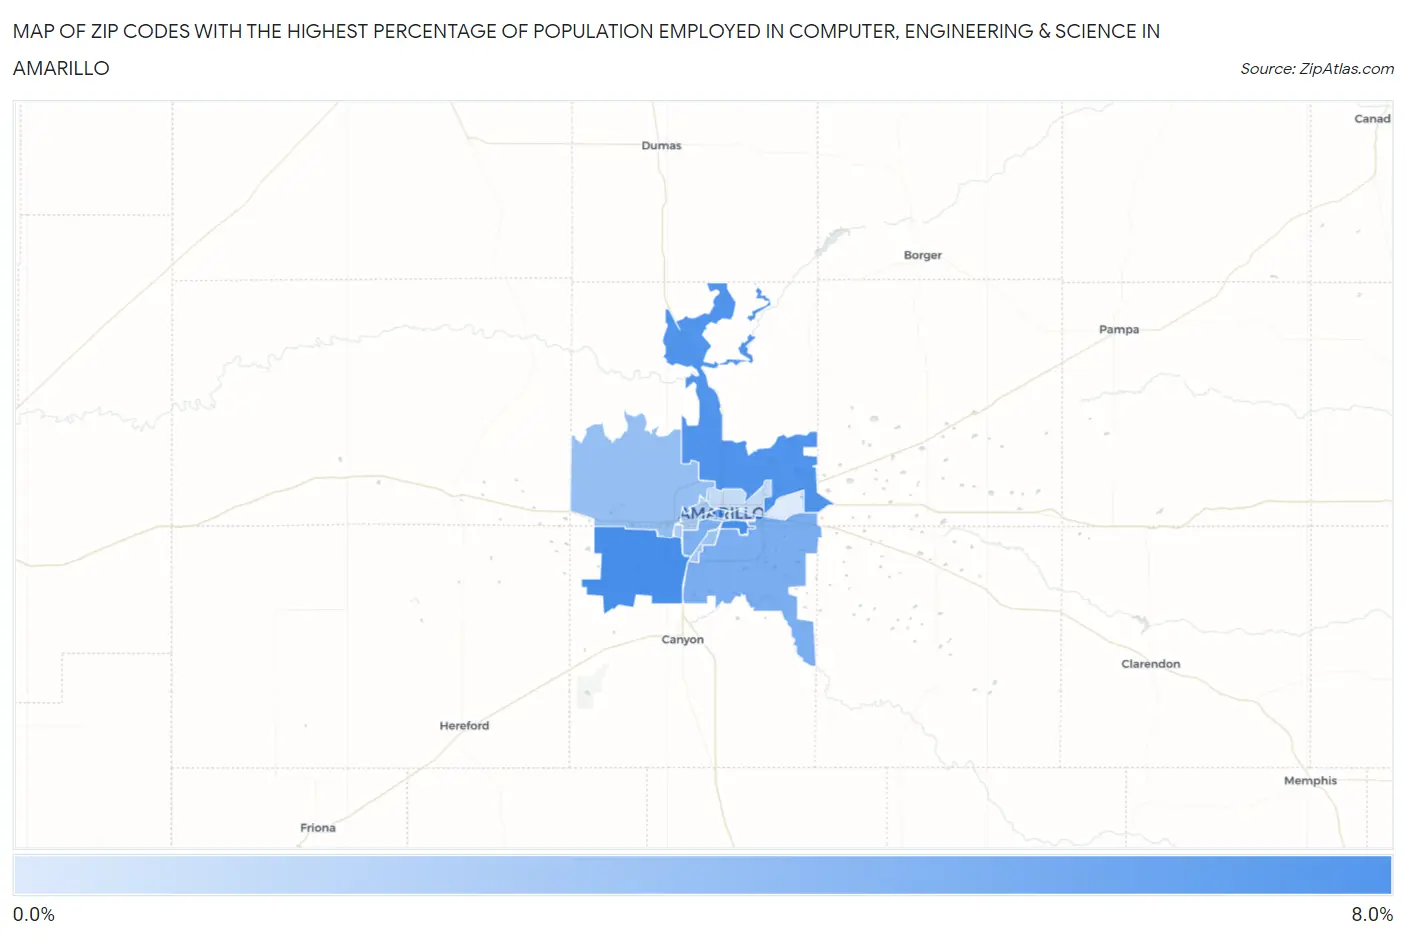
Map of Zip Codes with the Highest Percentage of Population Employed in Computer, Engineering & Science in Amarillo
0.15%
7.9%
Zip Codes with the Highest Percentage of Population Employed in Computer, Engineering & Science in Amarillo, TX
| Zip Code | % Employed | vs State | vs National | |
| 1. | 79103 | 7.9% | 6.5%(+1.41)#289 | 6.8%(+1.14)#5,400 |
| 2. | 79119 | 7.9% | 6.5%(+1.39)#290 | 6.8%(+1.12)#5,421 |
| 3. | 79108 | 7.4% | 6.5%(+0.915)#325 | 6.8%(+0.651)#6,141 |
| 4. | 79101 | 6.0% | 6.5%(-0.488)#460 | 6.8%(-0.752)#8,806 |
| 5. | 79118 | 5.3% | 6.5%(-1.24)#543 | 6.8%(-1.51)#10,682 |
| 6. | 79109 | 4.9% | 6.5%(-1.56)#590 | 6.8%(-1.82)#11,549 |
| 7. | 79124 | 3.8% | 6.5%(-2.70)#766 | 6.8%(-2.96)#15,150 |
| 8. | 79110 | 3.4% | 6.5%(-3.15)#857 | 6.8%(-3.41)#16,799 |
| 9. | 79106 | 2.7% | 6.5%(-3.81)#998 | 6.8%(-4.08)#19,296 |
| 10. | 79121 | 2.5% | 6.5%(-4.03)#1,057 | 6.8%(-4.29)#20,119 |
| 11. | 79104 | 2.3% | 6.5%(-4.25)#1,108 | 6.8%(-4.51)#20,904 |
| 12. | 79107 | 1.3% | 6.5%(-5.24)#1,350 | 6.8%(-5.50)#24,310 |
| 13. | 79102 | 0.95% | 6.5%(-5.55)#1,427 | 6.8%(-5.81)#25,163 |
| 14. | 79111 | 0.15% | 6.5%(-6.35)#1,536 | 6.8%(-6.61)#26,668 |
1
Common Questions
What are the Top 10 Zip Codes with the Highest Percentage of Population Employed in Computer, Engineering & Science in Amarillo, TX?
Top 10 Zip Codes with the Highest Percentage of Population Employed in Computer, Engineering & Science in Amarillo, TX are:
What zip code has the Highest Percentage of Population Employed in Computer, Engineering & Science in Amarillo, TX?
79103 has the Highest Percentage of Population Employed in Computer, Engineering & Science in Amarillo, TX with 7.9%.
What is the Percentage of Population Employed in Computer, Engineering & Science in Amarillo, TX?
Percentage of Population Employed in Computer, Engineering & Science in Amarillo is 4.3%.
What is the Percentage of Population Employed in Computer, Engineering & Science in Texas?
Percentage of Population Employed in Computer, Engineering & Science in Texas is 6.5%.
What is the Percentage of Population Employed in Computer, Engineering & Science in the United States?
Percentage of Population Employed in Computer, Engineering & Science in the United States is 6.8%.