Zip Codes with the Highest Percentage of Population Employed in Life, Physical & Social Science in Maryville, TN
RELATED REPORTS & OPTIONS
Life, Physical & Social Science
Maryville
Compare Zip Codes
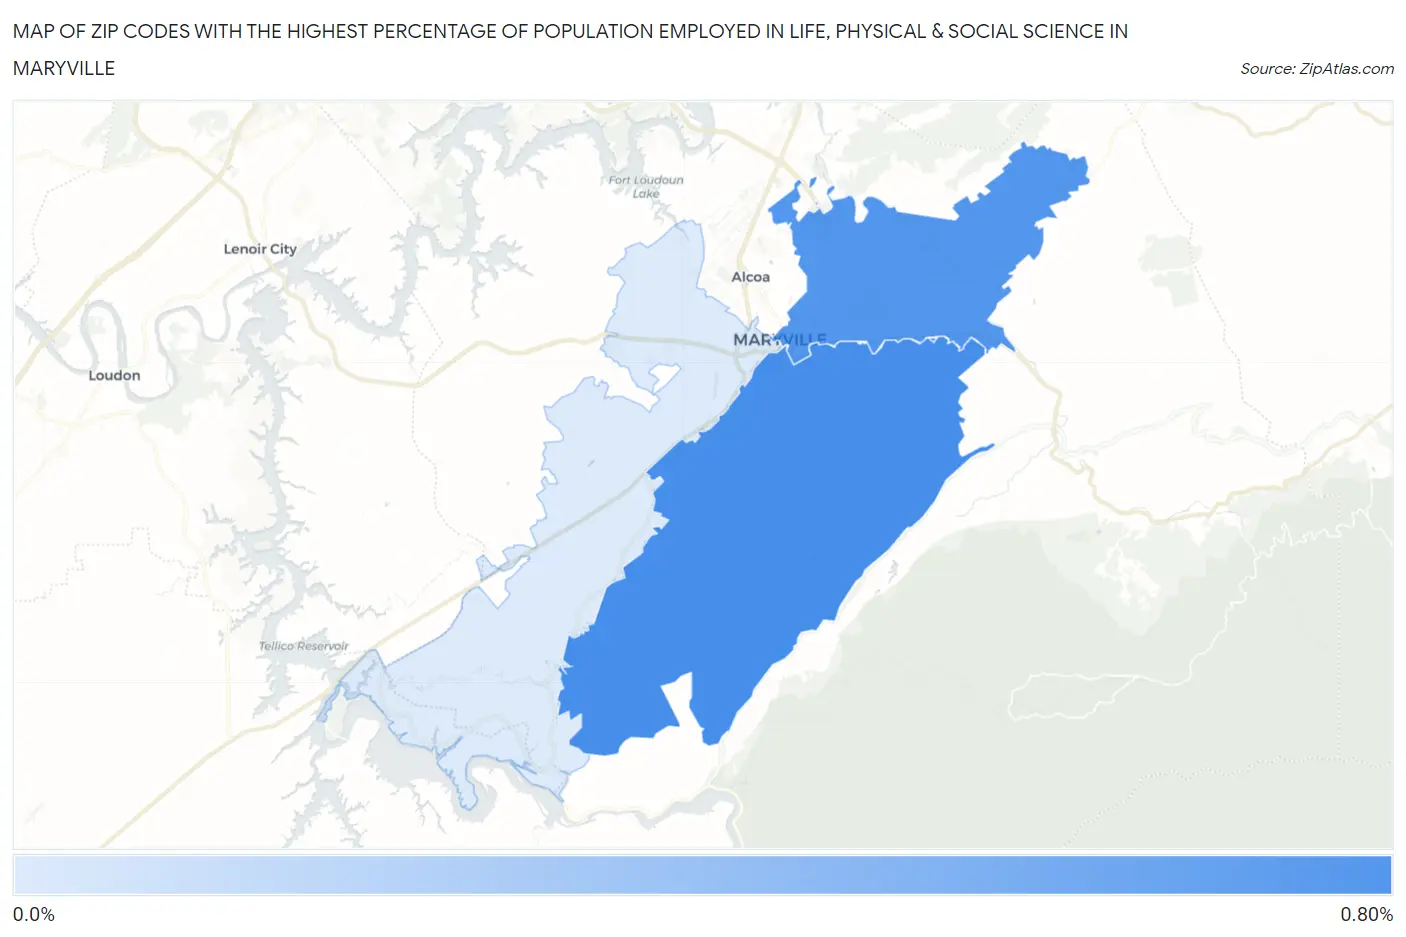
Map of Zip Codes with the Highest Percentage of Population Employed in Life, Physical & Social Science in Maryville
0.097%
0.68%
Zip Codes with the Highest Percentage of Population Employed in Life, Physical & Social Science in Maryville, TN
| Zip Code | % Employed | vs State | vs National | |
| 1. | 37803 | 0.68% | 0.83%(-0.149)#199 | 1.1%(-0.409)#12,273 |
| 2. | 37804 | 0.64% | 0.83%(-0.195)#211 | 1.1%(-0.455)#12,842 |
| 3. | 37801 | 0.097% | 0.83%(-0.735)#356 | 1.1%(-0.994)#19,094 |
1
Common Questions
What are the Top Zip Codes with the Highest Percentage of Population Employed in Life, Physical & Social Science in Maryville, TN?
Top Zip Codes with the Highest Percentage of Population Employed in Life, Physical & Social Science in Maryville, TN are:
What zip code has the Highest Percentage of Population Employed in Life, Physical & Social Science in Maryville, TN?
37803 has the Highest Percentage of Population Employed in Life, Physical & Social Science in Maryville, TN with 0.68%.
What is the Percentage of Population Employed in Life, Physical & Social Science in Maryville, TN?
Percentage of Population Employed in Life, Physical & Social Science in Maryville is 0.80%.
What is the Percentage of Population Employed in Life, Physical & Social Science in Tennessee?
Percentage of Population Employed in Life, Physical & Social Science in Tennessee is 0.83%.
What is the Percentage of Population Employed in Life, Physical & Social Science in the United States?
Percentage of Population Employed in Life, Physical & Social Science in the United States is 1.1%.