Zip Codes with the Highest Percentage of Population Employed in Food Preparation & Serving in Murfreesboro, TN
RELATED REPORTS & OPTIONS
Food Preparation & Serving
Murfreesboro
Compare Zip Codes
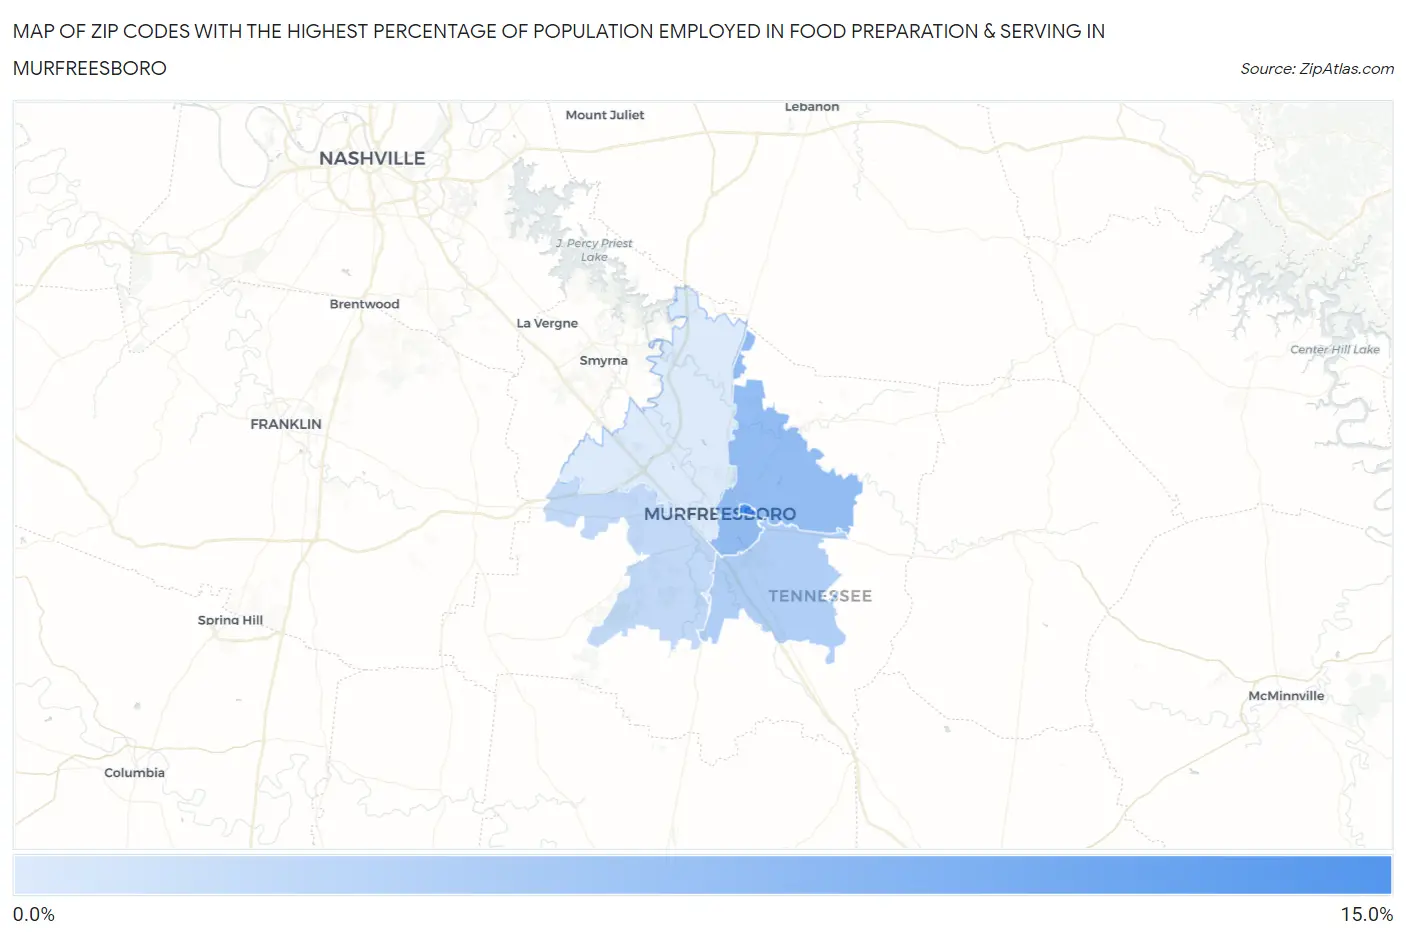
Map of Zip Codes with the Highest Percentage of Population Employed in Food Preparation & Serving in Murfreesboro
4.7%
12.3%
Zip Codes with the Highest Percentage of Population Employed in Food Preparation & Serving in Murfreesboro, TN
| Zip Code | % Employed | vs State | vs National | |
| 1. | 37132 | 12.3% | 5.4%(+6.91)#21 | 5.3%(+7.04)#1,561 |
| 2. | 37130 | 8.5% | 5.4%(+3.04)#79 | 5.3%(+3.17)#4,111 |
| 3. | 37127 | 6.9% | 5.4%(+1.50)#143 | 5.3%(+1.63)#6,777 |
| 4. | 37128 | 6.1% | 5.4%(+0.698)#186 | 5.3%(+0.831)#8,969 |
| 5. | 37129 | 4.7% | 5.4%(-0.673)#279 | 5.3%(-0.540)#13,967 |
1
Common Questions
What are the Top 3 Zip Codes with the Highest Percentage of Population Employed in Food Preparation & Serving in Murfreesboro, TN?
Top 3 Zip Codes with the Highest Percentage of Population Employed in Food Preparation & Serving in Murfreesboro, TN are:
What zip code has the Highest Percentage of Population Employed in Food Preparation & Serving in Murfreesboro, TN?
37132 has the Highest Percentage of Population Employed in Food Preparation & Serving in Murfreesboro, TN with 12.3%.
What is the Percentage of Population Employed in Food Preparation & Serving in Murfreesboro, TN?
Percentage of Population Employed in Food Preparation & Serving in Murfreesboro is 7.1%.
What is the Percentage of Population Employed in Food Preparation & Serving in Tennessee?
Percentage of Population Employed in Food Preparation & Serving in Tennessee is 5.4%.
What is the Percentage of Population Employed in Food Preparation & Serving in the United States?
Percentage of Population Employed in Food Preparation & Serving in the United States is 5.3%.