Zip Codes with the Highest Percentage of Population Employed in Food Preparation & Serving in Clarksville, TN
RELATED REPORTS & OPTIONS
Food Preparation & Serving
Clarksville
Compare Zip Codes
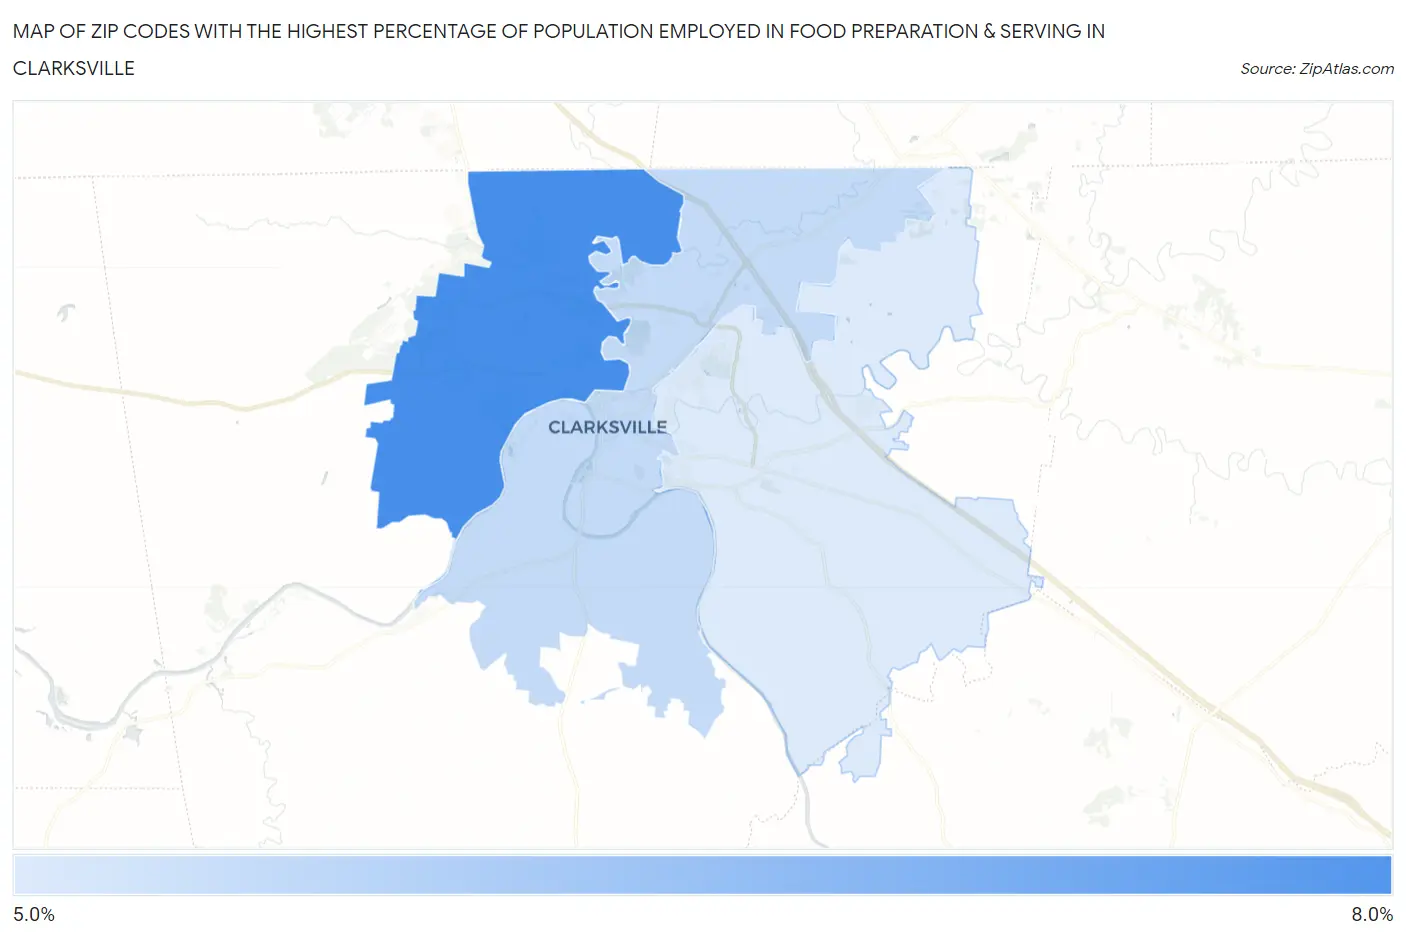
Map of Zip Codes with the Highest Percentage of Population Employed in Food Preparation & Serving in Clarksville
5.3%
7.1%
Zip Codes with the Highest Percentage of Population Employed in Food Preparation & Serving in Clarksville, TN
| Zip Code | % Employed | vs State | vs National | |
| 1. | 37042 | 7.1% | 5.4%(+1.66)#137 | 5.3%(+1.79)#6,389 |
| 2. | 37040 | 5.6% | 5.4%(+0.165)#218 | 5.3%(+0.298)#10,762 |
| 3. | 37043 | 5.3% | 5.4%(-0.133)#234 | 5.3%(+0.000)#11,820 |
1
Common Questions
What are the Top Zip Codes with the Highest Percentage of Population Employed in Food Preparation & Serving in Clarksville, TN?
Top Zip Codes with the Highest Percentage of Population Employed in Food Preparation & Serving in Clarksville, TN are:
What zip code has the Highest Percentage of Population Employed in Food Preparation & Serving in Clarksville, TN?
37042 has the Highest Percentage of Population Employed in Food Preparation & Serving in Clarksville, TN with 7.1%.
What is the Percentage of Population Employed in Food Preparation & Serving in Clarksville, TN?
Percentage of Population Employed in Food Preparation & Serving in Clarksville is 6.4%.
What is the Percentage of Population Employed in Food Preparation & Serving in Tennessee?
Percentage of Population Employed in Food Preparation & Serving in Tennessee is 5.4%.
What is the Percentage of Population Employed in Food Preparation & Serving in the United States?
Percentage of Population Employed in Food Preparation & Serving in the United States is 5.3%.