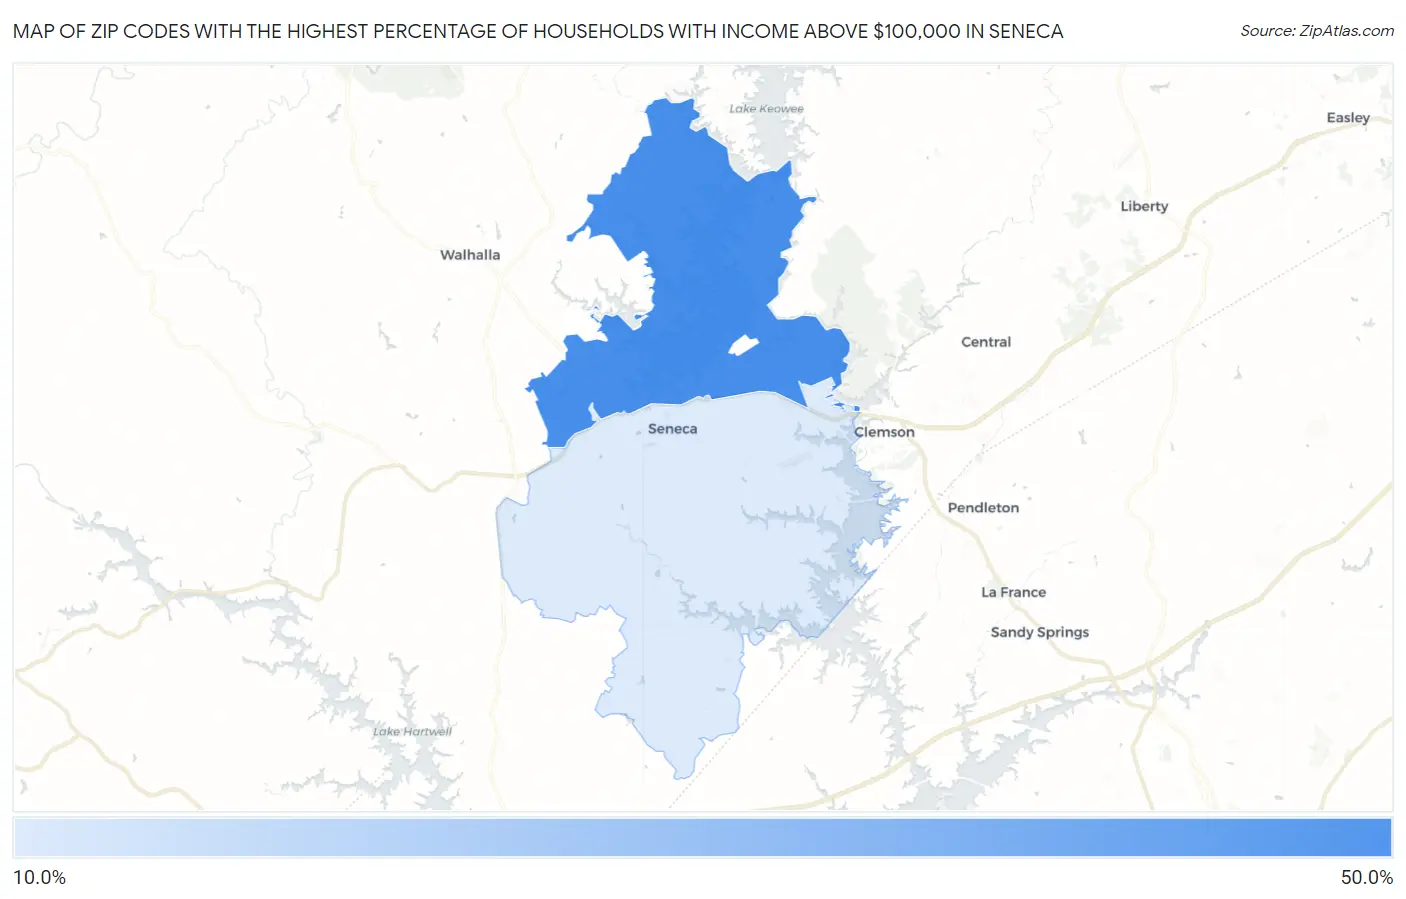
Zip Codes with the Highest Percentage of Households with Income Above $100,000 in Seneca, SC
RELATED REPORTS & OPTIONS
Household Income | $100k+
Seneca
Compare Zip Codes
Map of Zip Codes with the Highest Percentage of Households with Income Above $100,000 in Seneca
19.1%
42.5%
Zip Codes with the Highest Percentage of Households with Income Above $100,000 in Seneca, SC
| Zip Code | Households with Income > $100k | vs State | vs National | |
| 1. | 29672 | 42.5% | 29.7%(+12.8)#39 | 37.3%(+5.20)#7,680 |
| 2. | 29678 | 19.1% | 29.7%(-10.6)#240 | 37.3%(-18.2)#24,749 |
1
Common Questions
What are the Top Zip Codes with the Highest Percentage of Households with Income Above $100,000 in Seneca, SC?
Top Zip Codes with the Highest Percentage of Households with Income Above $100,000 in Seneca, SC are:
What zip code has the Highest Percentage of Households with Income Above $100,000 in Seneca, SC?
29672 has the Highest Percentage of Households with Income Above $100,000 in Seneca, SC with 42.5%.
What is the Percentage of Households with Income Above $100,000 in Seneca, SC?
Percentage of Households with Income Above $100,000 in Seneca is 23.3%.
What is the Percentage of Households with Income Above $100,000 in South Carolina?
Percentage of Households with Income Above $100,000 in South Carolina is 29.7%.
What is the Percentage of Households with Income Above $100,000 in the United States?
Percentage of Households with Income Above $100,000 in the United States is 37.3%.