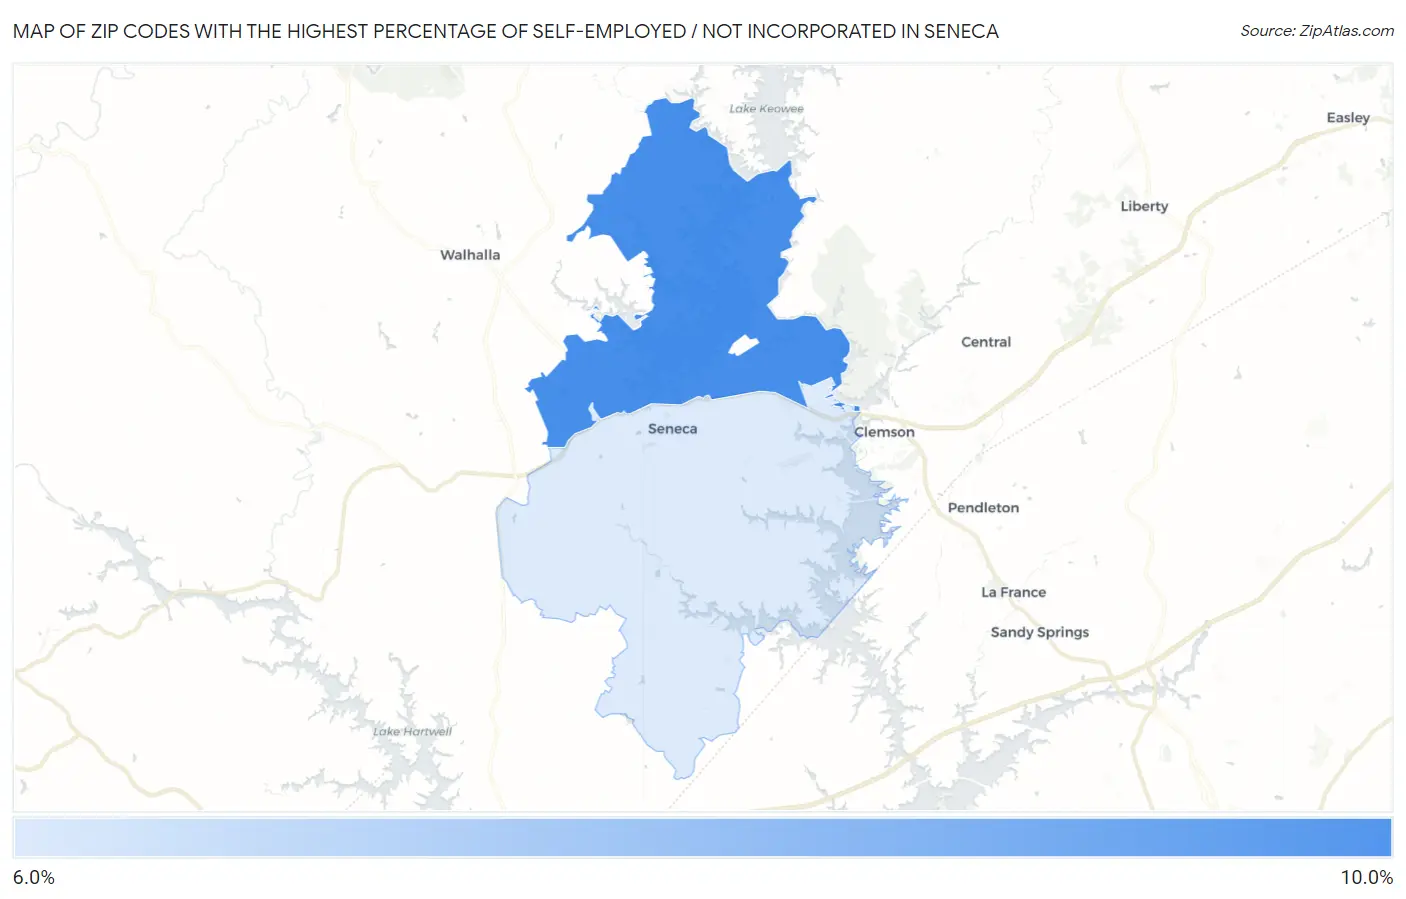
Zip Codes with the Highest Percentage of Self-Employed / Not Incorporated in Seneca, SC
RELATED REPORTS & OPTIONS
Self-Employed / Not Incorporated
Seneca
Compare Zip Codes
Map of Zip Codes with the Highest Percentage of Self-Employed / Not Incorporated in Seneca
0.0%
10.0%
Zip Codes with the Highest Percentage of Self-Employed / Not Incorporated in Seneca, SC
| Zip Code | % Self-Employed / Not Incorporated | vs State | vs National | |
| 1. | 29672 | 9.0% | 5.5%(+3.46)#51 | 5.8%(+3.18)#8,780 |
| 2. | 29678 | 6.1% | 5.5%(+0.524)#144 | 5.8%(+0.243)#15,879 |
1
Common Questions
What are the Top Zip Codes with the Highest Percentage of Self-Employed / Not Incorporated in Seneca, SC?
Top Zip Codes with the Highest Percentage of Self-Employed / Not Incorporated in Seneca, SC are:
What zip code has the Highest Percentage of Self-Employed / Not Incorporated in Seneca, SC?
29672 has the Highest Percentage of Self-Employed / Not Incorporated in Seneca, SC with 9.0%.
What is the Percentage of Self-Employed / Not Incorporated in Seneca, SC?
Percentage of Self-Employed / Not Incorporated in Seneca is 2.7%.
What is the Percentage of Self-Employed / Not Incorporated in South Carolina?
Percentage of Self-Employed / Not Incorporated in South Carolina is 5.5%.
What is the Percentage of Self-Employed / Not Incorporated in the United States?
Percentage of Self-Employed / Not Incorporated in the United States is 5.8%.