Zip Codes with the Highest Percentage of Households With Two or more Vehicles in Seneca, SC
RELATED REPORTS & OPTIONS
Households with 2 or more Cars
Seneca
Compare Zip Codes
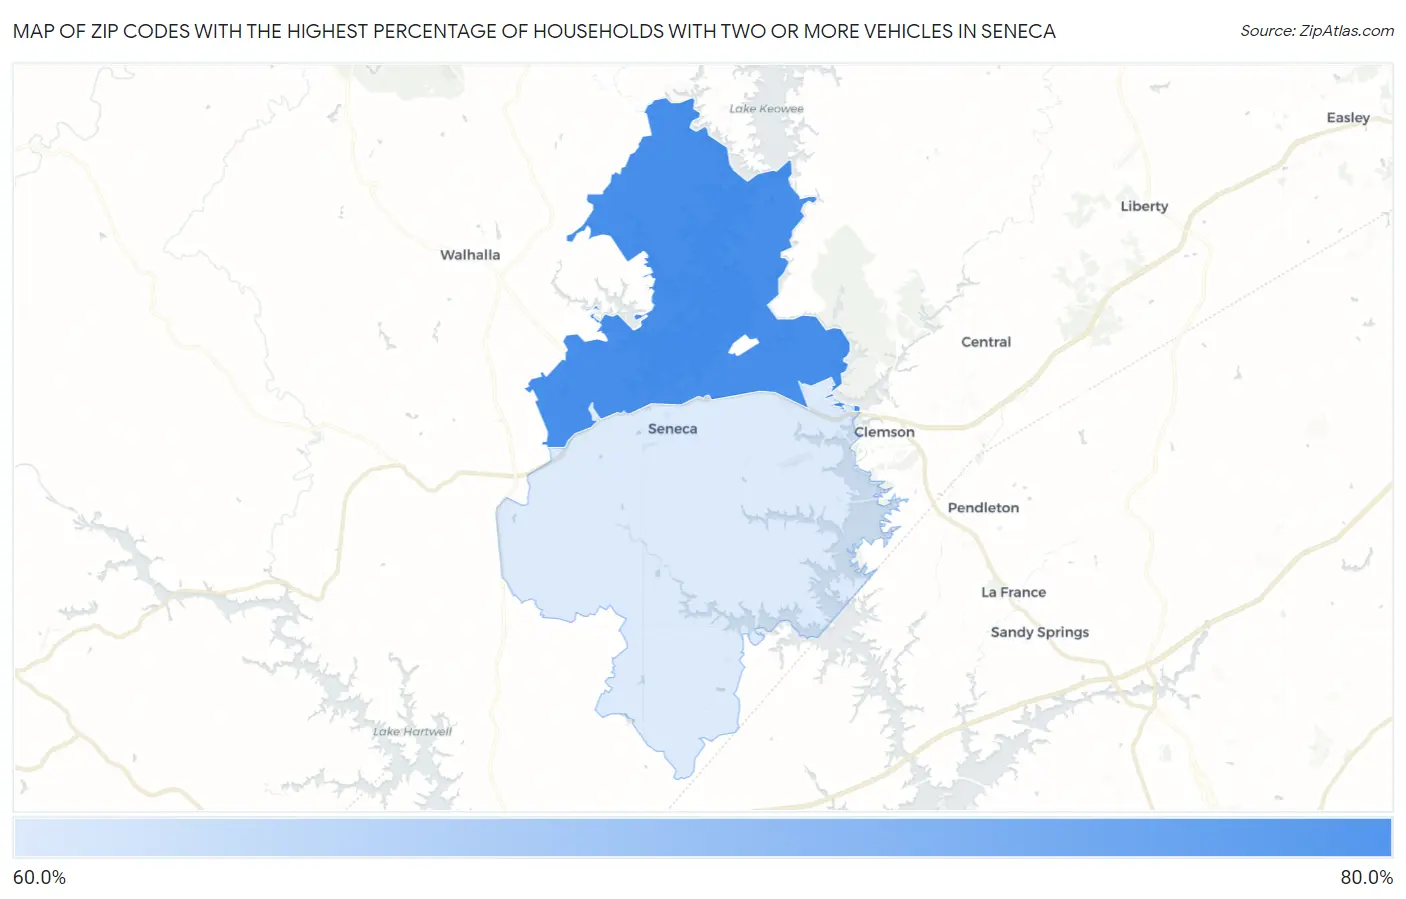
Map of Zip Codes with the Highest Percentage of Households With Two or more Vehicles in Seneca
60.6%
72.5%
Zip Codes with the Highest Percentage of Households With Two or more Vehicles in Seneca, SC
| Zip Code | Housholds With 2+ Cars | vs State | vs National | |
| 1. | 29672 | 72.5% | 62.1%(+10.4)#82 | 59.1%(+13.4)#11,225 |
| 2. | 29678 | 60.6% | 62.1%(-1.50)#249 | 59.1%(+1.50)#22,184 |
1
Common Questions
What are the Top Zip Codes with the Highest Percentage of Households With Two or more Vehicles in Seneca, SC?
Top Zip Codes with the Highest Percentage of Households With Two or more Vehicles in Seneca, SC are:
What zip code has the Highest Percentage of Households With Two or more Vehicles in Seneca, SC?
29672 has the Highest Percentage of Households With Two or more Vehicles in Seneca, SC with 72.5%.
What is the Percentage of Households With Two or more Vehicles in Seneca, SC?
Percentage of Households With Two or more Vehicles in Seneca is 52.8%.
What is the Percentage of Households With Two or more Vehicles in South Carolina?
Percentage of Households With Two or more Vehicles in South Carolina is 62.1%.
What is the Percentage of Households With Two or more Vehicles in the United States?
Percentage of Households With Two or more Vehicles in the United States is 59.1%.