Zip Codes with the Highest Percentage of Population Employed in Security & Protection in Seneca, SC
RELATED REPORTS & OPTIONS
Security & Protection
Seneca
Compare Zip Codes
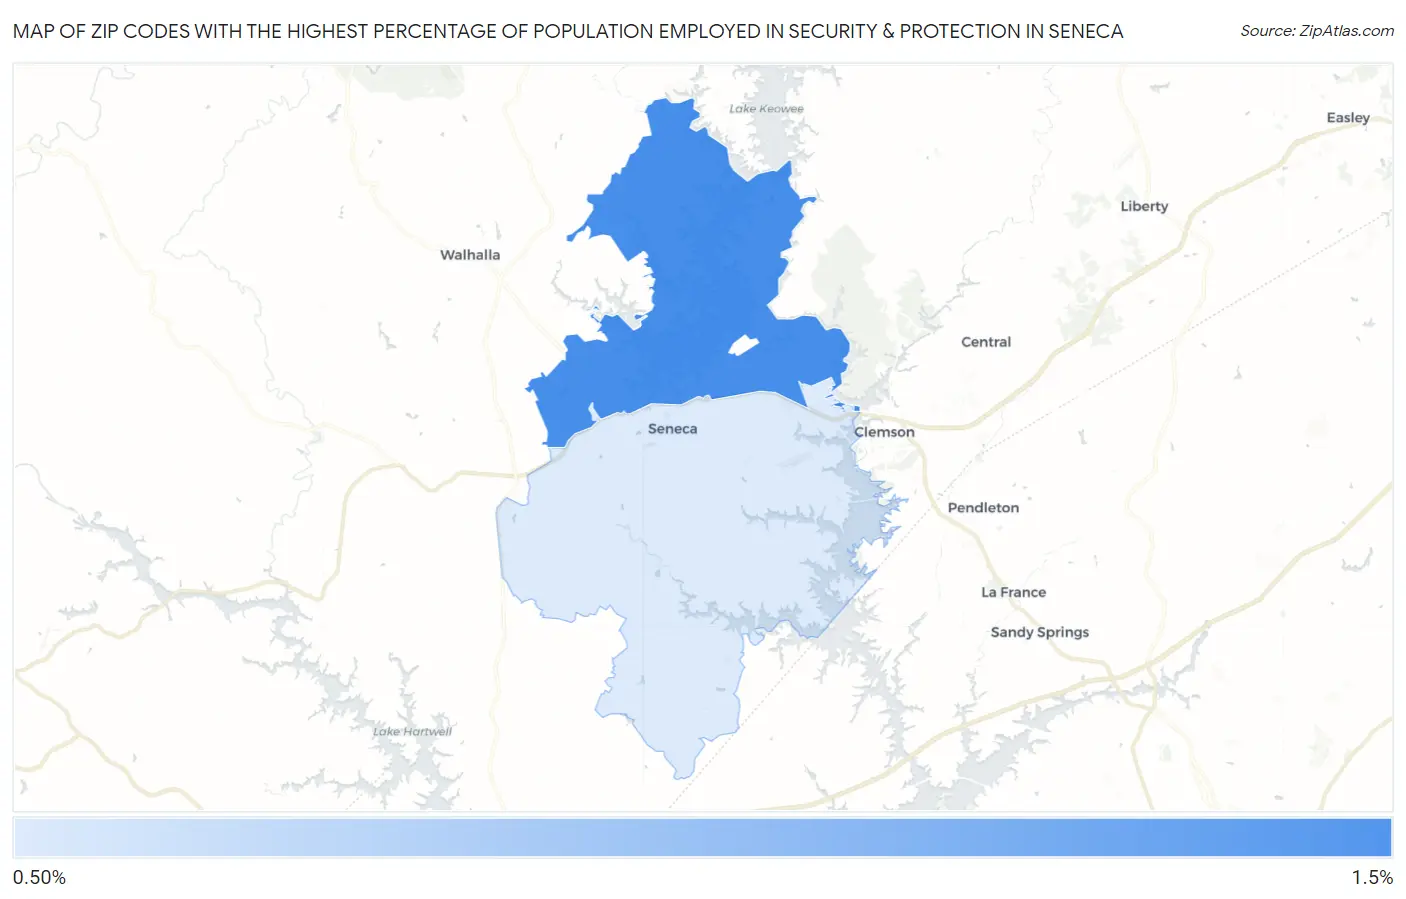
Map of Zip Codes with the Highest Percentage of Population Employed in Security & Protection in Seneca
1.0%
1.2%
Zip Codes with the Highest Percentage of Population Employed in Security & Protection in Seneca, SC
| Zip Code | % Employed | vs State | vs National | |
| 1. | 29672 | 1.2% | 2.1%(-0.917)#267 | 2.1%(-0.966)#18,644 |
| 2. | 29678 | 1.0% | 2.1%(-1.06)#282 | 2.1%(-1.11)#19,716 |
1
Common Questions
What are the Top Zip Codes with the Highest Percentage of Population Employed in Security & Protection in Seneca, SC?
Top Zip Codes with the Highest Percentage of Population Employed in Security & Protection in Seneca, SC are:
What zip code has the Highest Percentage of Population Employed in Security & Protection in Seneca, SC?
29672 has the Highest Percentage of Population Employed in Security & Protection in Seneca, SC with 1.2%.
What is the Percentage of Population Employed in Security & Protection in Seneca, SC?
Percentage of Population Employed in Security & Protection in Seneca is 1.3%.
What is the Percentage of Population Employed in Security & Protection in South Carolina?
Percentage of Population Employed in Security & Protection in South Carolina is 2.1%.
What is the Percentage of Population Employed in Security & Protection in the United States?
Percentage of Population Employed in Security & Protection in the United States is 2.1%.