Zip Codes with the Highest Percentage of Families with Income Above $100,000 in Seneca, SC
RELATED REPORTS & OPTIONS
Family Income | $100k+
Seneca
Compare Zip Codes
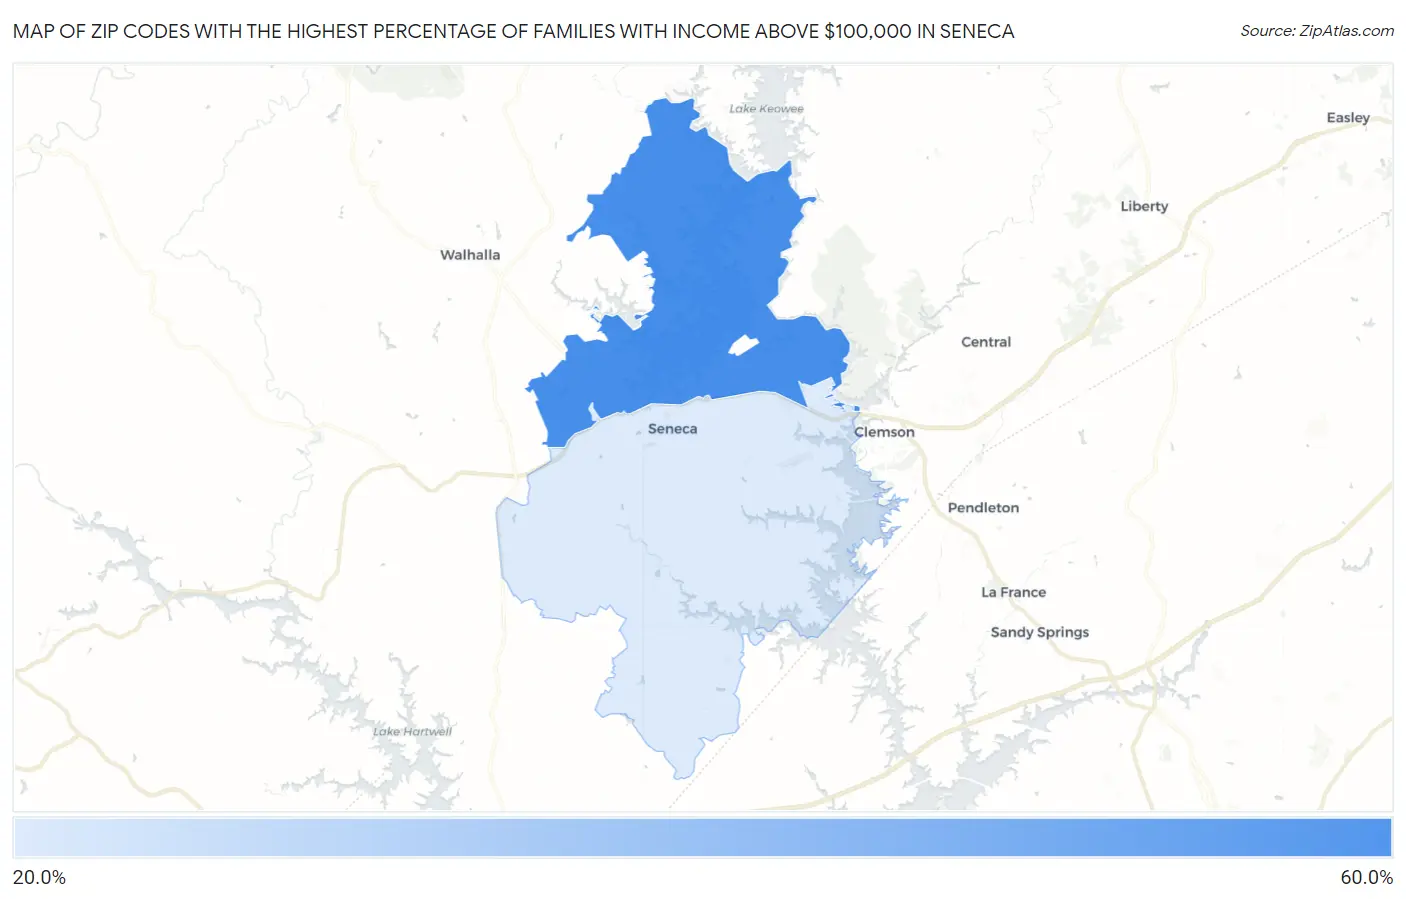
Map of Zip Codes with the Highest Percentage of Families with Income Above $100,000 in Seneca
26.8%
53.2%
Zip Codes with the Highest Percentage of Families with Income Above $100,000 in Seneca, SC
| Zip Code | Families with Income > $100k | vs State | vs National | |
| 1. | 29672 | 53.2% | 38.5%(+14.7)#45 | 46.1%(+7.10)#7,466 |
| 2. | 29678 | 26.8% | 38.5%(-11.7)#232 | 46.1%(-19.3)#23,555 |
1
Common Questions
What are the Top Zip Codes with the Highest Percentage of Families with Income Above $100,000 in Seneca, SC?
Top Zip Codes with the Highest Percentage of Families with Income Above $100,000 in Seneca, SC are:
What zip code has the Highest Percentage of Families with Income Above $100,000 in Seneca, SC?
29672 has the Highest Percentage of Families with Income Above $100,000 in Seneca, SC with 53.2%.
What is the Percentage of Families with Income Above $100,000 in Seneca, SC?
Percentage of Families with Income Above $100,000 in Seneca is 33.8%.
What is the Percentage of Families with Income Above $100,000 in South Carolina?
Percentage of Families with Income Above $100,000 in South Carolina is 38.5%.
What is the Percentage of Families with Income Above $100,000 in the United States?
Percentage of Families with Income Above $100,000 in the United States is 46.1%.