Zip Codes with the Most Births per 1,000 Women in Labor Force in Seneca, SC
RELATED REPORTS & OPTIONS
Highest Birth Rate | In Labor Force
Seneca
Compare Zip Codes
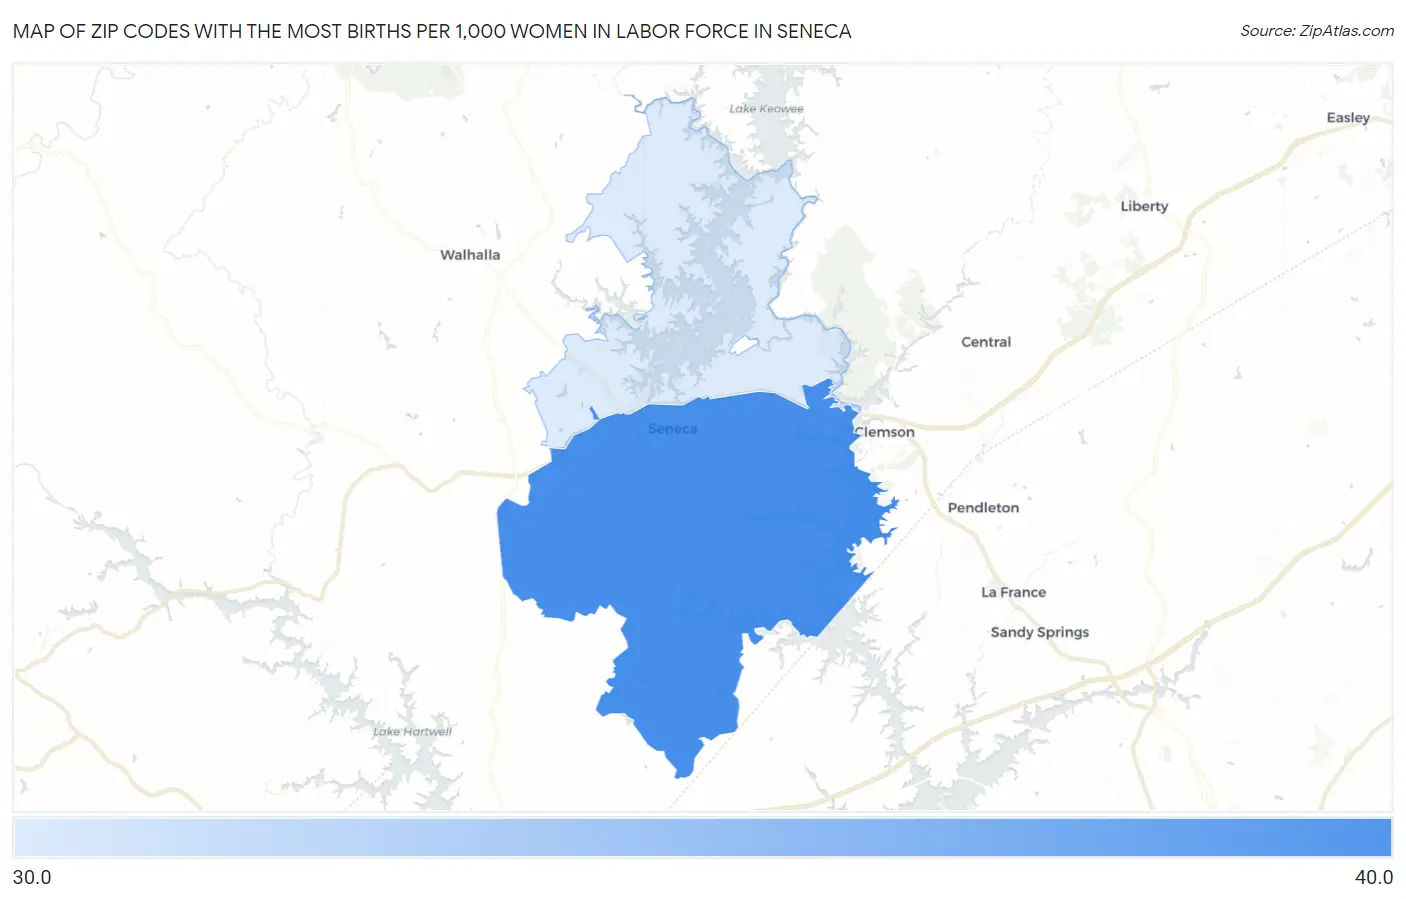
Map of Zip Codes with the Most Births per 1,000 Women in Labor Force in Seneca
30.0
34.0
Zip Codes with the Most Births per 1,000 Women in Labor Force in Seneca, SC
| Zip Code | Births / 1,000 Women | vs State | vs National | |
| 1. | 29678 | 34.0 | 49.0(-15.0)#225 | 48.0(-14.0)#16,484 |
| 2. | 29672 | 30.0 | 49.0(-19.0)#244 | 48.0(-18.0)#17,803 |
1
Common Questions
What are the Top Zip Codes with the Most Births per 1,000 Women in Labor Force in Seneca, SC?
Top Zip Codes with the Most Births per 1,000 Women in Labor Force in Seneca, SC are:
What zip code has the Most Births per 1,000 Women in Labor Force in Seneca, SC?
29678 has the Most Births per 1,000 Women in Labor Force in Seneca, SC with 34.0.
What is the Number of Births per 1,000 Women in Labor Force in Seneca, SC?
Number of Births per 1,000 Women in Labor Force in Seneca is 3.0.
What is the Number of Births per 1,000 Women in Labor Force in South Carolina?
Number of Births per 1,000 Women in Labor Force in South Carolina is 49.0.
What is the Number of Births per 1,000 Women in Labor Force in the United States?
Number of Births per 1,000 Women in Labor Force in the United States is 48.0.